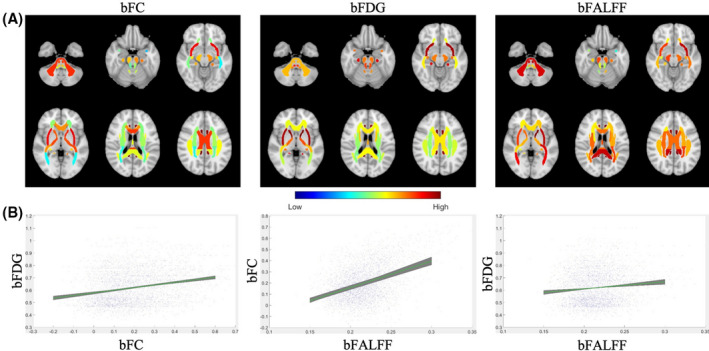
FIGURE 2.

Distributions of bFC, bFDG and bFALFF measures and pairwise correlations between them. A, Distributions of average bFC (left), bFDG (middle), and bFALFF (right) in selected axial slices (see Supporting Information Figures S1–S3 for full brain distributions). Note that for visualization purposes, average values of these measures are mapped to the original atlas with no WM mask erosions. Note that the values of bFALFF have been rescaled from the original range of [0.20, 0.25] to [0.40, 1] for enhanced visualization. B, Scatter plots of linear relationships between bFC and bFDG, bFALFF and bFC, and bFALFF and bFDG. Tight regions shaded in green illustrate highly consistent linear fitting of the three measure pairs across six fMRI sessions
