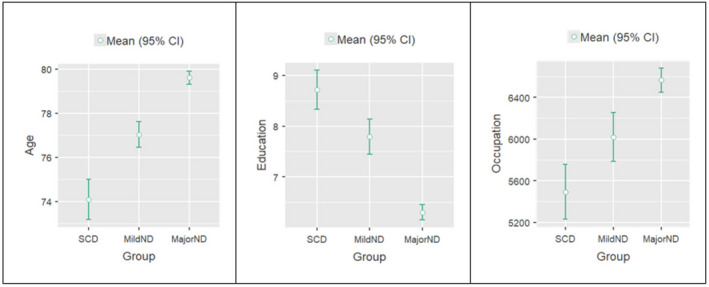
FIGURE 1.

Predictors in the groups. The graphs show the mean differences in age (years), education (years) and occupation (ISCO‐08 codes: lower scores indicate more complex occupations) resulting from one‐way ANOVA between the three groups (SCD, MildND and MajorND)
