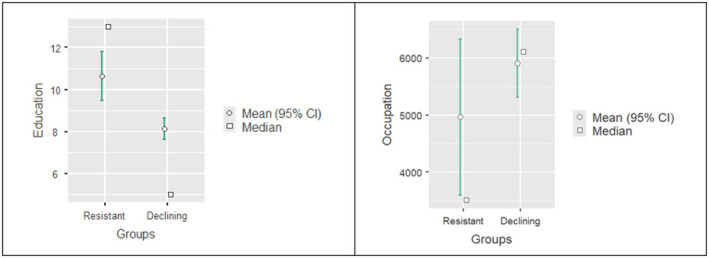
FIGURE 3.

Education and occupation effects on resistant and declining individuals at the third assessment. The graphs represent the mean difference of education (on the left‐hand side) and occupation (on the right‐hand side) between resistant and declining at the third assessment (T3)
