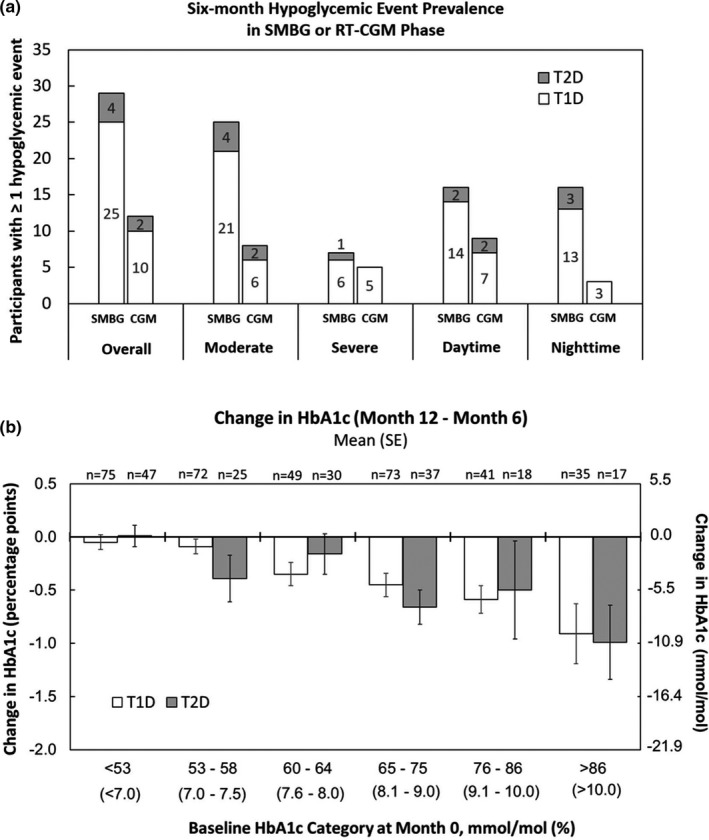
FIGURE 2.

(a) Six‐month prevalences of hypoglycaemic events during periods of SMBG and RT‐CGM use in the PP population for participants with T2D (grey bars) or T1D (white bars). (b) Change in HbA1c levels between Month 6 (end of SMBG phase) and Month 12 (end of CGM phase) for participants with T1D (white bars) and T2D (grey bars). Participants were grouped by baseline (Month 0) HbA1c levels
