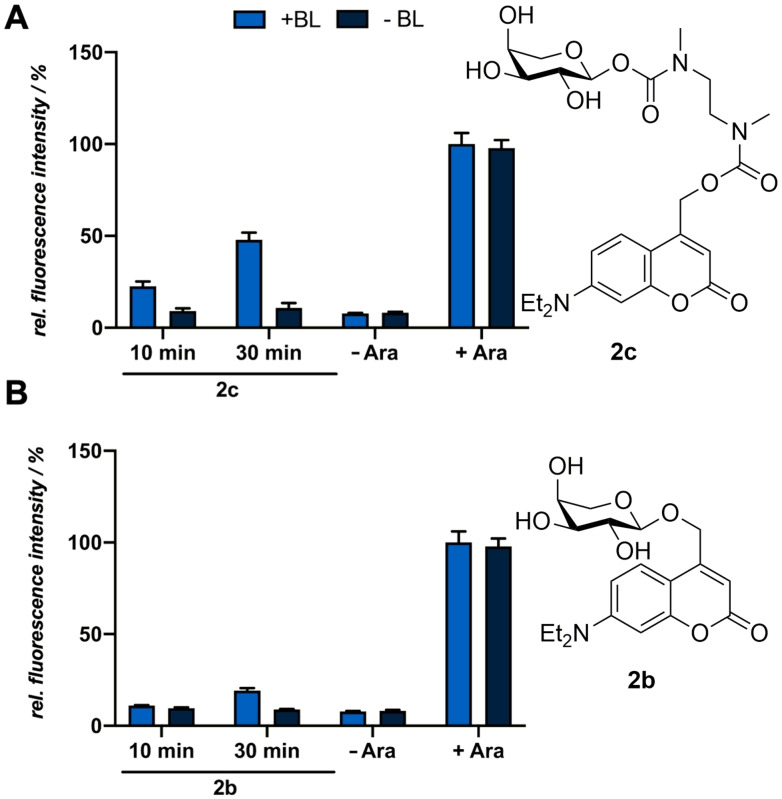
Figure 5.
Normalized in vivo mCherry fluorescence intensity of E. coli LMG194/pBTBX‐2‐mCherry expression cultures supplemented with 50 μm of the photocaged arabinose variants 2 c (A) and 2 b (B). All cultures were incubated in the dark for 20 h in LB medium at 37 °C and light‐mediated induction of reporter gene expression was performed after 2.5 h by blue light exposure at 447 nm (+BL; ∼10 mW cm−2) for 10 or 30 min or the addition of respective amounts of conventional arabinose (2 a). In vivo fluorescence intensities were determined by using a Tecan Microplate Reader (mCherry: λex=580 nm, λem=610 nm), normalized to cell densities and are shown in relation to the respective fluorescence intensities of a culture induced with conventional arabinose (2 a) and exposed to blue light for 30 min. Values are means of triplicate measurements. Error bars indicate the respective standard deviations.

