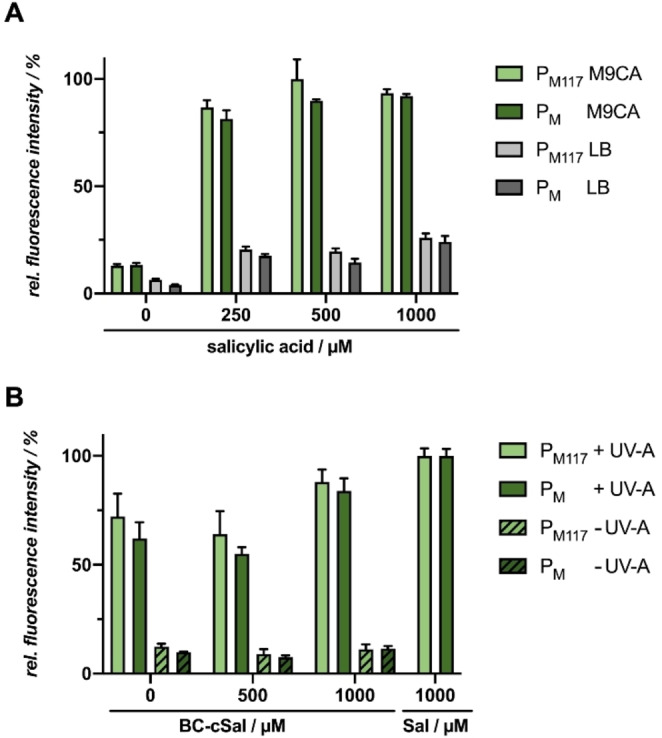
Figure 7.

Light‐controlled gene expression in E. coli Tuner (DE3)/pM117(pM)‐R45T‐GFPmut3 using BC‐cSal (22 a). A) In vivo GFPmut3 fluorescence (λex=508 nm, λem=532 nm) of E. coli cultures grown in LB medium (grey) or M9CA minimal medium (green) at 30 °C after 20 h (stationary growth phase). Induction was performed after 6 h with salicylic acid (21) concentrations ranging from 0 to 1000 μm. B) In vivo GFPmut3 fluorescence (λex=508 nm, λem=532 nm) of E. coli cultures grown in M9CA minimal medium at 30 °C and supplemented with 500 μm or 1000 μm of BC‐cSal (22 a) is shown in relation to a 0 and 1000 μm salicylic acid (Sal) control after 20 h (stationary growth phase). Induction was performed after 6 h via UV‐A light exposure at 365 nm (∼1 mW cm−2) for 30 min or the addition of 1000 μm salicylic acid (Sal). In vivo fluorescence intensities were normalized to cell densities and values are means of individual biological triplicates. Error bars indicate the respective standard deviations.
