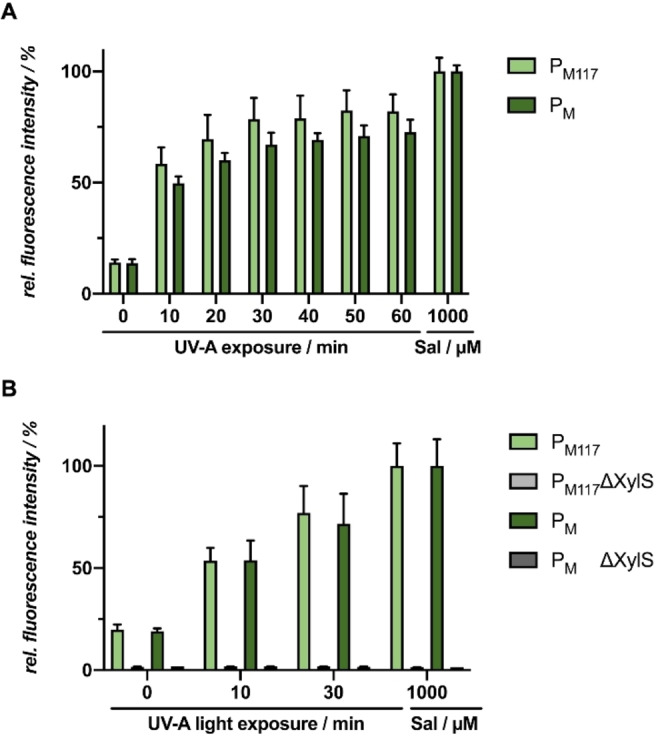
Figure 8.

Light‐controlled gene expression in E. coli Tuner(DE3)/pM117‐R45T‐GFPmut3 or pM‐R45T‐GFPmut3 using UV‐A light. A) In vivo GFPmut3 fluorescence (λex=508 nm, λem=532 nm) of E. coli cultures illuminated with UV‐A light for different exposure time is shown in relation to a salicylic acid control (Sal). Induction was performed after 6 h via UV‐A light exposure at 365 nm (∼1 mW cm−2) or the addition of 1000 μm Sal. B) In vivo GFPmut3 fluorescence of E. coli cultures harbouring plasmid with both XylS gene and, as a negative control, a xylS gene deletion (ΔXylS) plasmid variant and illuminated with UV‐A light for 10–30 min is shown in relation to a 1000 μm salicylic acid control (Sal). Induction was performed after 6 h via UV‐A light exposure at 365 nm (∼1 mW cm−2) or the addition of 1000 μm Sal. In vivo fluorescence intensities were normalized to cell densities and values are means of individual biological triplicates. Error bars indicate the respective standard deviations.
