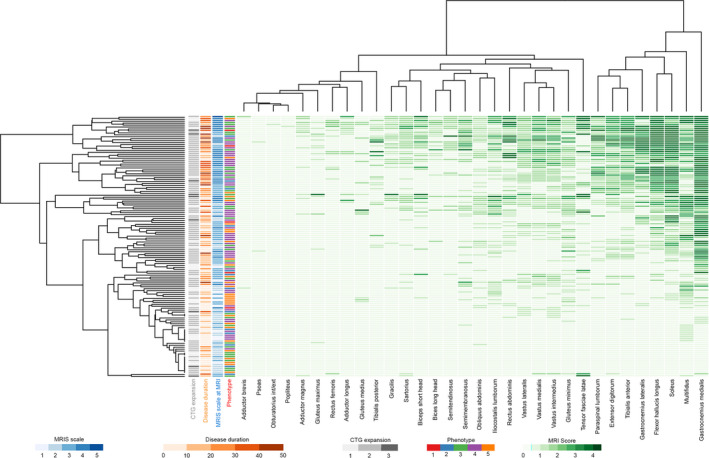
FIGURE 4.

Heatmap of lower limbs. Hierarchical clustering matching severity of muscle involvement in each muscle (apsis) and overall T1 score (ordinat) in all patients. Each column represents one muscle and each line represents one patient. Darker green rectangles represent a higher T1‐Mercuri score. On the right side of the heatmap are located the most severely affected muscles (higher global T1 score), while in the upper part of the panel there are the more severe patients (higher global T1 score). Most of the more severely affected muscles are leg muscles (right side). In the middle of the panel are located muscles with moderate fat replacement as the result (1) of the average score between the distal‐replaced (score of 3–4) and proximal‐spared part (score 0–1) of the muscle (e.g., vasti) or (2) of a moderate but homogeneous fat replacement along the whole muscle bulk (e.g., semimembranosus). On the left side are the most spared muscles even in more severe patients (psoas, adductor brevis, obturatori, popliteus). Among patients, in the lower part of the panel there are patients with minimal or absent muscle involvement at magnetic resonance imaging (MRI) and just above there are those patients with minimal MRI alterations. Note that some patients with Muscular Impairment Rating Scale (MIRS) of 3 do not show MRI changes (probably underestimated because of a lacking upper limb study). Conversely, patients with MIRS 1 or 2 (milder‐asymptomatic spectrum of disease) can show muscle MRI alterations. The T1 score correlates with MIRS and disease duration but only weakly with CTG expansion
