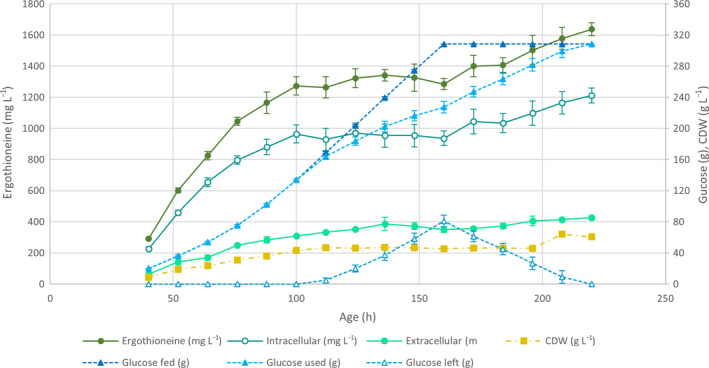
Fig. 4.

Phosphate‐limited fed‐batch fermentation of ST10264 in 1 L bioreactors. The total, extracellular and intracellular ERG levels are represented by lines with circular markers. The amount of glucose that was fed to the strain, used by the strain and left in the reactor is represented by lines with triangular markers. The CDW is represented by a line with square markers. Average values and standard deviations are presented in the graph (n = 3, error bars signify SD).
