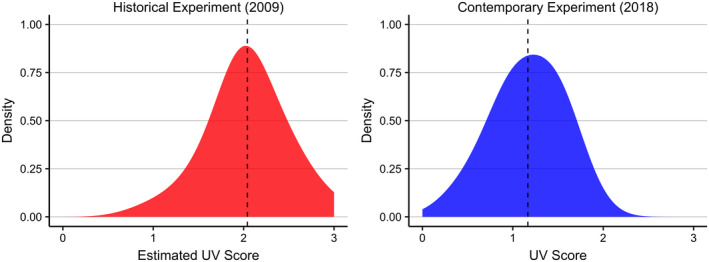
FIGURE 5.

Density plots of infection severity as indicated by degree of orange fluorescence under ultraviolet light in bats from the historical and contemporary translocation experiments in Extirpated (Warm + Wet). A UV score of 0 = no orange fluorescence indicative of infection, 1 = 1–10% of wing area displays orange fluorescence, 2 = 10–50% of wing area displays fluorescence, and 3 = 50–100% of wing area displays fluorescence. Dashed lines correspond to average values. Bats translocated to the extirpated site in 2009 were naïve to WNS and displayed a higher degree of infection severity compared to the non‐naïve bats translocated to the same site in 2018
