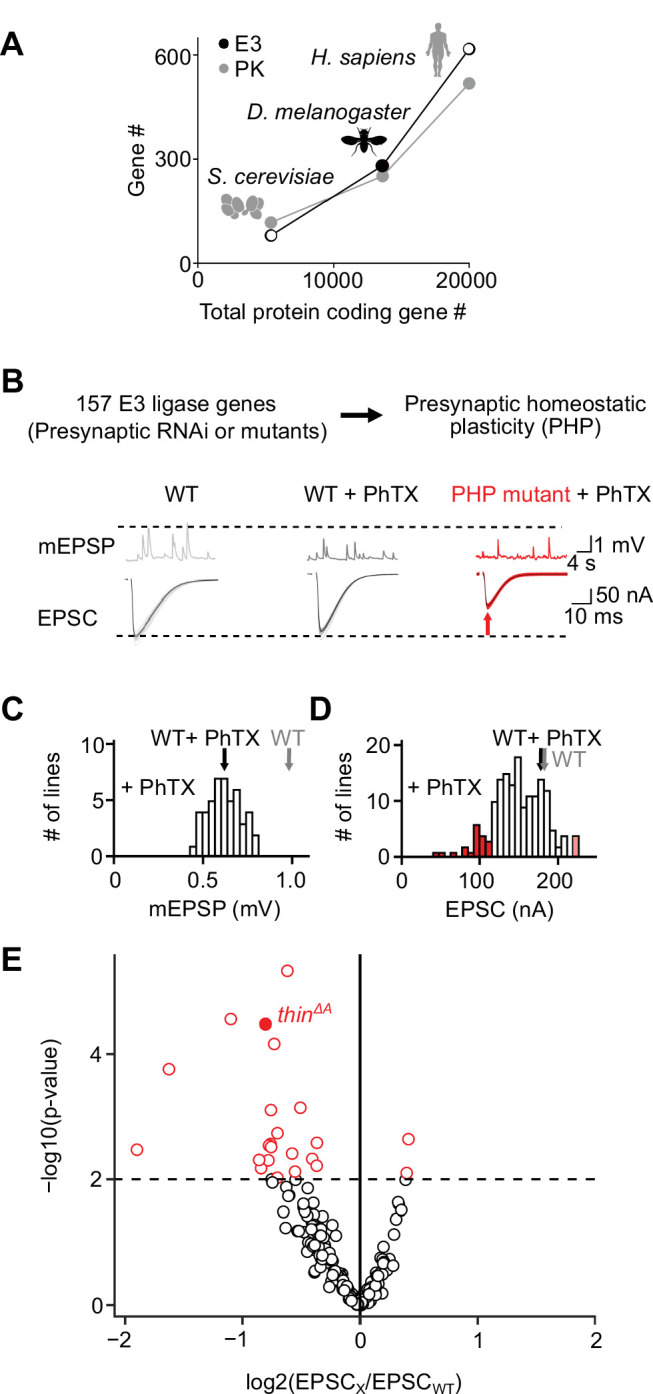
Figure 1. An electrophysiology-based genetic screen identifies thin as a synaptic homeostasis gene.
(A) The number of putative E3 ubiquitin ligase-encoding genes (E3) and protein kinase-encoding genes (PK) as a function of total protein-coding gene number of C. cerevisiae, D. melanogaster, and H. sapiens. Note the similar relationship between E3 number or PK number and total protein-coding gene number across species. (B) Top: 157 E3 ligase-encoding genes and 11 associated genes (180 lines; presynaptic RNAi expression, elavc155-Gal4>UAS RNAi, or mutants, note that some genes were targeted by more than one line) were tested using two-electrode voltage clamp analysis at the Drosophila neuromuscular junction (NMJ) in the presence of the glutamate receptor (GluR) antagonist philanthotoxin-443 (‘PhTX’) to assess presynaptic homeostatic plasticity (PHP) (see Materials and methods). Bottom: Exemplary miniature excitatory postsynaptic potentials (mEPSPs) and action potential (AP)-evoked excitatory postsynaptic currents (EPSCs) recorded from wild-type (WT), WT in the presence of PhTX (‘WT + PhTX’), and a PHP mutant in the presence of PhTX (‘PHP mutant + PhTX’). Note the decrease in mEPSP amplitude after PhTX treatment, indicating GluR inhibition, and the similar EPSC amplitude between WT and WT + PhTX, suggesting PHP. Small EPSC amplitudes in the presence of PhTX (red arrow) imply a defect in PHP or baseline synaptic transmission. (C) Histogram of mean mEPSP amplitudes for each transgenic or mutant line (mean n = 4 NMJs per line, range 3–12; N = 180 lines) following PhTX treatment. WT averages under control conditions (‘WT’, n = 16) and in the presence of PhTX (‘WT + PhTX’, n = 16) are shown as gray and black arrows, respectively. (D) Histogram of mean EPSC amplitudes (as in C). The red bars indicate transgenic or mutant lines with EPSC amplitudes significantly different from WT in the presence of PhTX (black arrow). (E) Volcano plot of the ratio between the mean EPSC amplitude of a transgenic or mutant line and WT (‘EPSCx/EPSCWT’) in the presence of PhTX (p values from one-way analysis of variance [ANOVA] with Tukey’s multiple comparisons). Transgenic or mutant lines with mean EPSC amplitude changes with p ≤ 0.01 (dashed line) are shown in red. A deletion in the gene thin (CG15105; thinΔA; LaBeau-DiMenna et al., 2012) that was selected for further analysis is shown as a filled red circle. One-way ANOVA with Tukey’s multiple comparisons was performed for statistical testing (C–E).


