. 2022 Jul 1;11:e78982. doi: 10.7554/eLife.78982

Figure 1. Agonist-induced structural change measured at each domain using conformational fluorescence resonance energy transfer (FRET) sensors.

(A) Full-length cryo-EM structures of inactive (7EPA) and fully active (7E9G) metabotropic glutamate receptor 2 (mGluR2; human) and schematic illustrating fluorophore placement for each inter-domain sensor. (B) Representative normalized live-cell FRET trace from glutamate titration experiment on HEK293T cells expressing azi-extracellular loop 2 (azi-ECL2). Data was acquired at 4.5 s time resolution. Dose-response curves from live-cell FRET orthosteric agonist titration experiments using (C) azi-ECL2, (D) N-terminal SNAP-tag labeled mGluR2 (SNAP-m2), and (E) azi-cysteine-rich domain (azi-CRD). Data is acquired from individual cells and normalized to 1 mM glutamate response. Data represents mean ± SEM of responses from individual cells from at least three independent experiments. Total number of cells examined, mean half-maximum effective concentration (EC50), mean max response, and errors are listed in Tables 1–2.

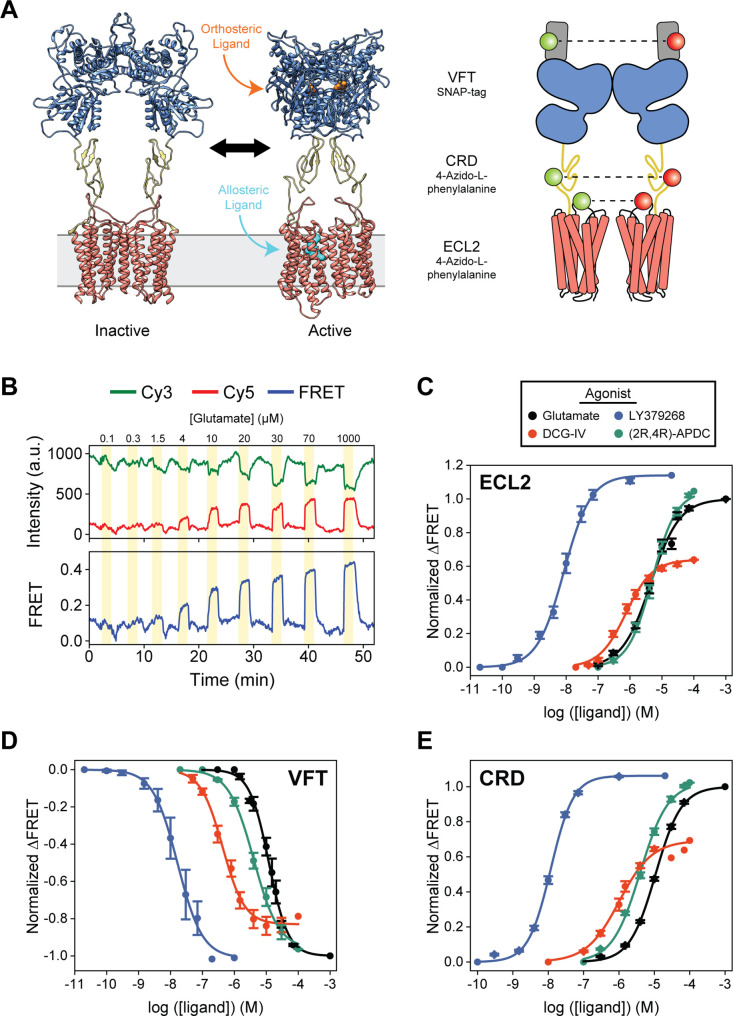
Figure 1—source data 1. Source data for Figure 1.

Figure 1.

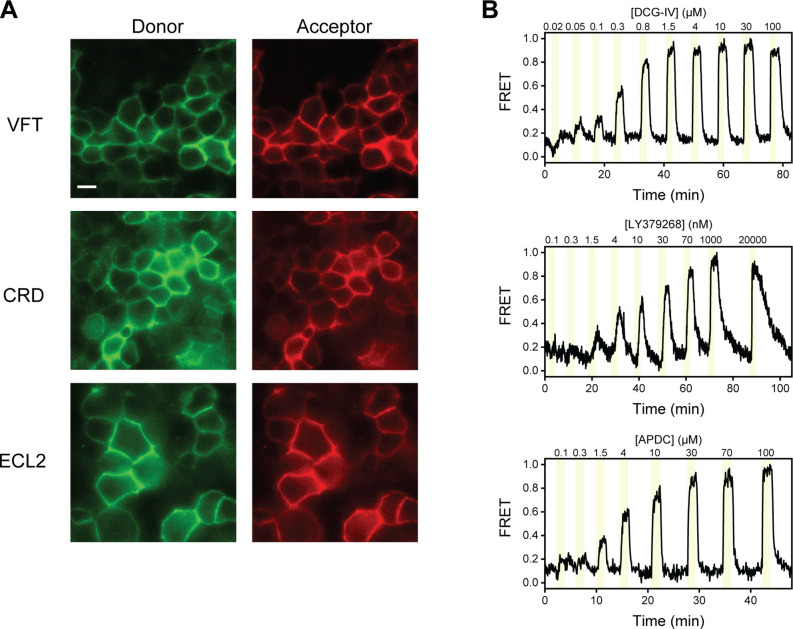
Figure 1—figure supplement 1. Representative images and fluorescence resonance energy transfer (FRET) traces from live-cell FRET experiments.

Figure 1—figure supplement 1.

(A) Representative image of HEK293T cells expressing N-terminal SNAP-tag labeled metabotropic glutamate receptor 2 (SNAP-m2), azi-cysteine-rich domain (azi-CRD), or azi-extracellular loop 2 (azi-ECL2) labeled with donor (left) and acceptor (right) fluorophores used for live-cell FRET experiments. Scale bar, 10 μM. (B) Representative normalized live-cell FRET traces of DCG-IV, LY379268, and (2R,4R)-APDC titration experiments on HEK293T cells expressing azi-ECL2. Data was acquired at 4.5 s time resolution.

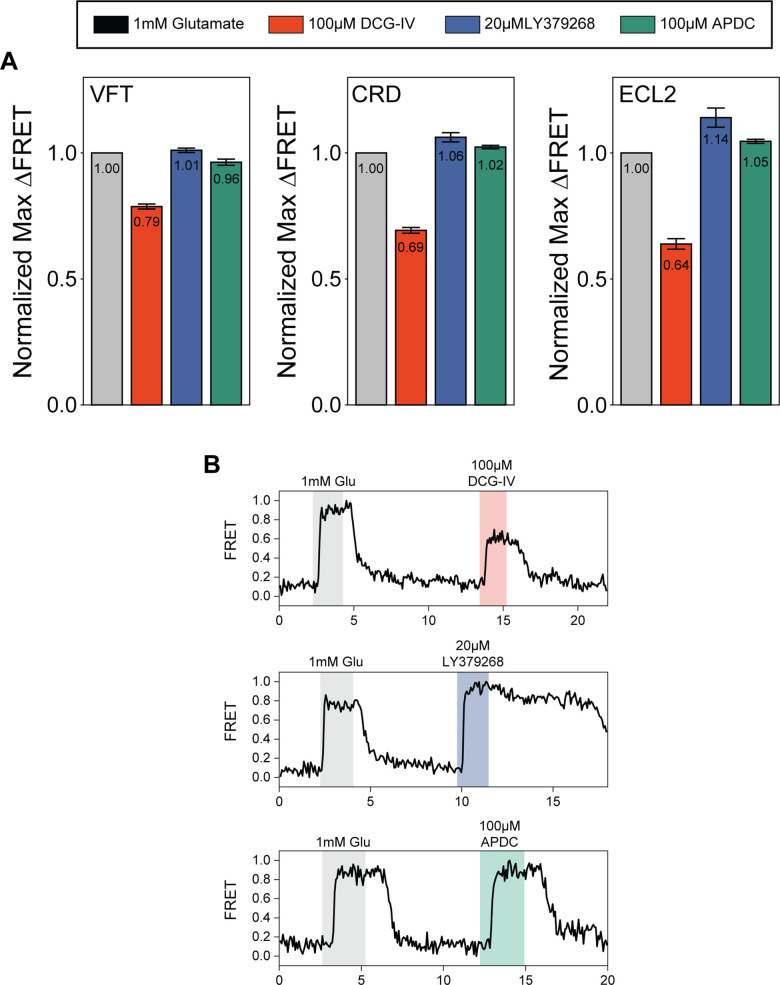
Figure 1—figure supplement 2. Quantification of orthosteric agonist efficacy.

Figure 1—figure supplement 2.

(A) Normalized maximal agonist-induced fluorescence resonance energy transfer (FRET) change for metabotropic glutamate receptor 2 (mGluR2) N-terminal SNAP-tag (SNAP-m2), azi-cysteine-rich domain (azi-CRD), and azi-extracellular loop 2 (azi-ECL2) sensors. Data represents mean ± SEM of responses from individual cells from at least three independent experiments. Total number of cells examined for normalization experiments, mean max response, and errors are listed in Table 2. (B) Representative normalized live-cell FRET traces from DCG-IV, LY379268, and (2R,4R)-APDC normalization experiments of azi-ECL2. Data is normalized to 1 mM glutamate response and collected at 4.5 s time resolution.

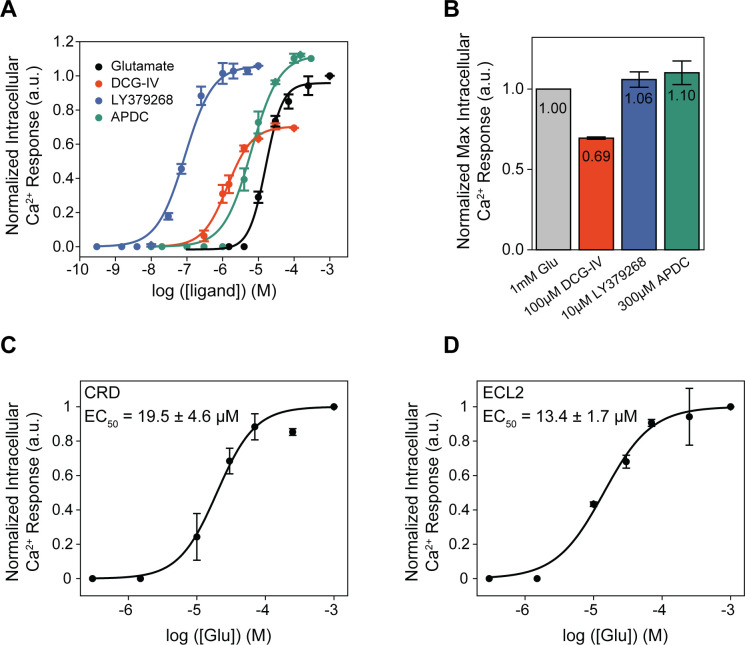
Figure 1—figure supplement 3. Orthosteric agonists examined by functional calcium imaging.

Figure 1—figure supplement 3.

(A) Dose-response curves for metabotropic glutamate receptor 2 (mGluR2)-induced calcium flux during orthosteric agonist titrations. (B) Normalized maximal agonist-induced intracellular calcium levels. Glutamate dose-response curves for calcium flux induced by (C) azi-cysteine-rich domain (azi-CRD) and (D) azi-extracellular loop 2 (azi-ECL2). Data is normalized to 1 mM glutamate response. Data represents mean ± SEM of results from three independent experiments.