. 2022 Jul 1;11:e78982. doi: 10.7554/eLife.78982

Figure 2. Positive and negative allosteric modulation of metabotropic glutamate receptor 2 (mGluR2) structural domains.

N-terminal SNAP-tag labeled mGluR2; hereafter (SNAP-m2) glutamate dose-response curves in the presence of (A) positive allosteric modulators (PAMs) or (B) NAMs. (C) Changes in glutamate potency and efficacy for SNAP-m2. The azi-cysteine-rich domain (azi-CRD) glutamate dose-response curves in the presence of (D) PAMs or (E) NAMs. (F) Changes in glutamate potency and efficacy for azi-CRD. The azi-extracellular loop 2 (azi-ECL2) glutamate dose-response curves in the presence of (G) PAMs or (H) NAMs. (I) Changes in glutamate potency and efficacy for azi-ECL2. (J) Changes in glutamate efficacy in response to PAMs and NAMs as measured by each conformational sensor. ΔPotency defined as (([modulator + glutamate]EC50 – [glutamate] EC50)/[glutamate] EC50) × 100. ΔEfficacy defined as ([1 mM glutamate + modulator] – [1 mM glutamate]) × 100. Data is acquired from individual cells and normalized to 1 mM glutamate response. Data represents mean ± SEM of responses from individual cells from at least three independent experiments. Total number of cells examined for titration and normalization experiments, mean half-maximum effective concentration (EC50), mean max response, and errors are listed in Tables 1–2.

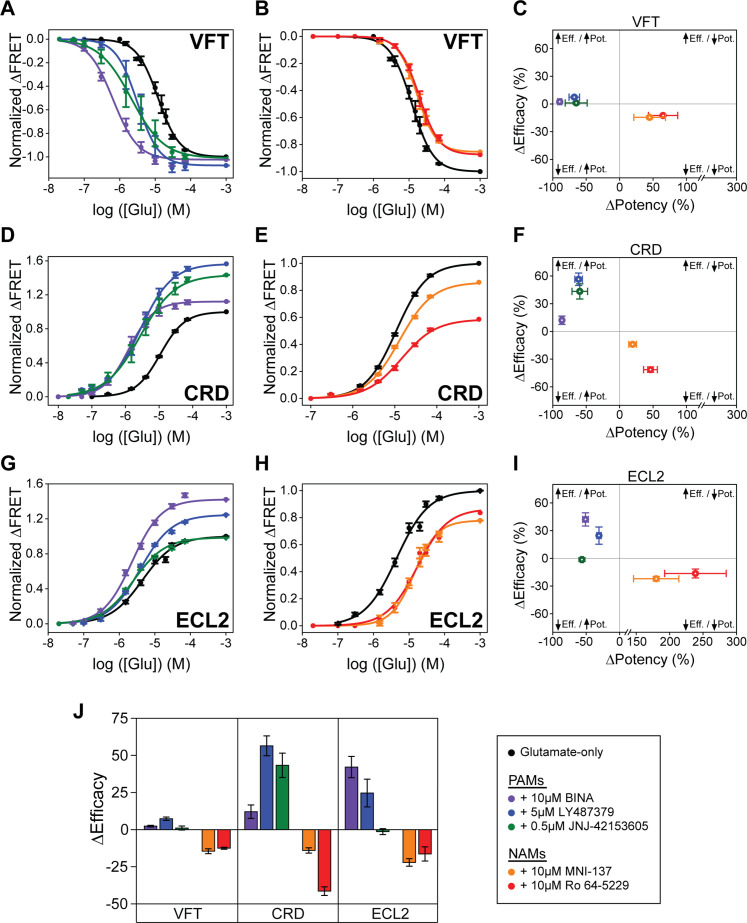
Figure 2—source data 1. Source data for Figure 2.

Figure 2.

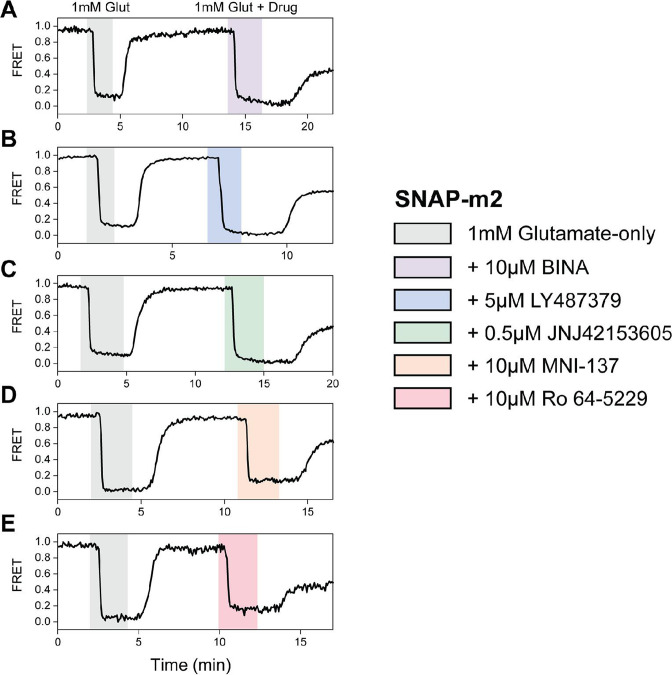
Figure 2—figure supplement 1. Max normalization of Δ fluorescence resonance energy transfer (ΔFRET) for N-terminal SNAP-tag labeled metabotropic glutamate receptor 2 (SNAP-m2).

Figure 2—figure supplement 1.

(A–E) Representative normalized live-cell FRET traces of SNAP-m2 normalization experiments for all positive and negative allosteric modulators tested. Data was acquired at 4 s time resolution.
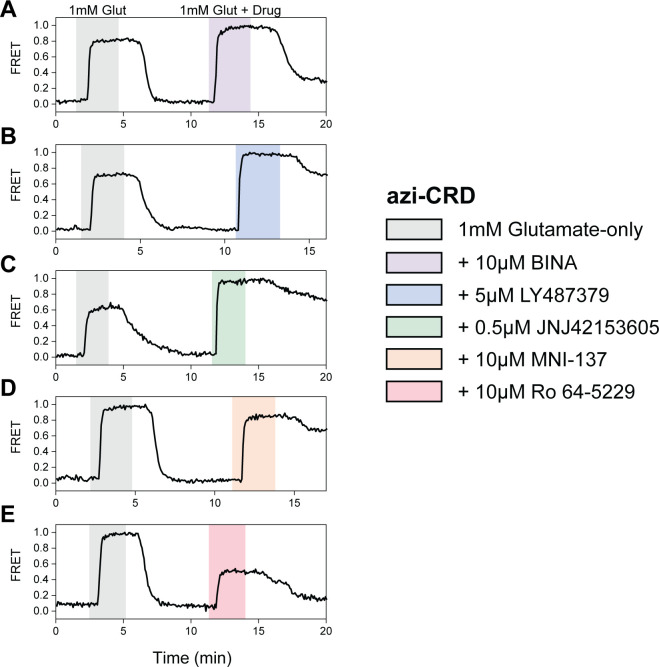
Figure 2—figure supplement 2. Max normalization of Δfluorescence resonance energy transfer (ΔFRET) for azi-cysteine-rich domain (azi-CRD).

Figure 2—figure supplement 2.

(A–E) Representative normalized live-cell FRET traces of azi-CRD normalization experiments for all positive and negative allosteric modulators tested. Data was acquired at 4.5 s time resolution.
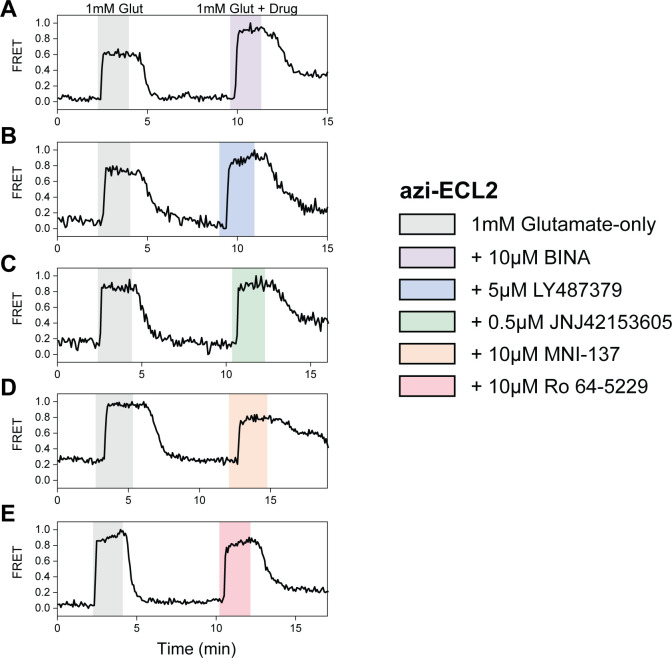
Figure 2—figure supplement 3. Max normalization of Δfluorescence resonance energy transfer (ΔFRET) for azi-ECL2.

Figure 2—figure supplement 3.

(A–E) Representative normalized live-cell FRET traces of azi-ECL2 normalization experiments for all positive and negative allosteric modulators tested. Data was acquired at 4.5 s time resolution.
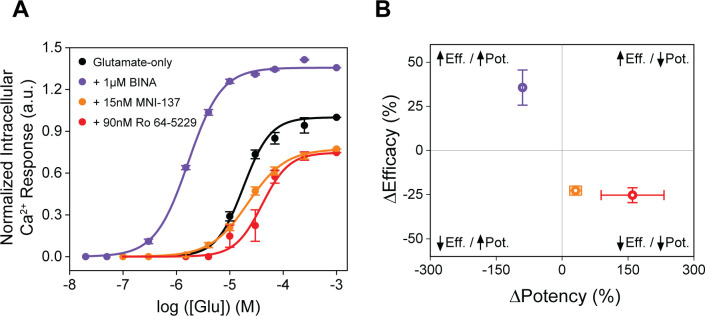
Figure 2—figure supplement 4. Allosteric modulators examined by functional calcium imaging.

Figure 2—figure supplement 4.

(A) Glutamate dose-response curves with and without allosteric modulators for metabotropic glutamate receptor 2 (mGluR2)-induced calcium flux. (B) Changes in glutamate potency and efficacy in response to allosteric modulator treatment, measured by intracellular calcium levels. ΔPotency defined as (([modulator + glutamate]EC50 – [glutamate] EC50)/[glutamate] EC50) × 100. ΔEfficacy defined as ([1 mM glutamate + modulator] – [1 mM glutamate]) × 100. Data is normalized to 1 mM glutamate response. Data represents mean ± SEM of results from three independent experiments.
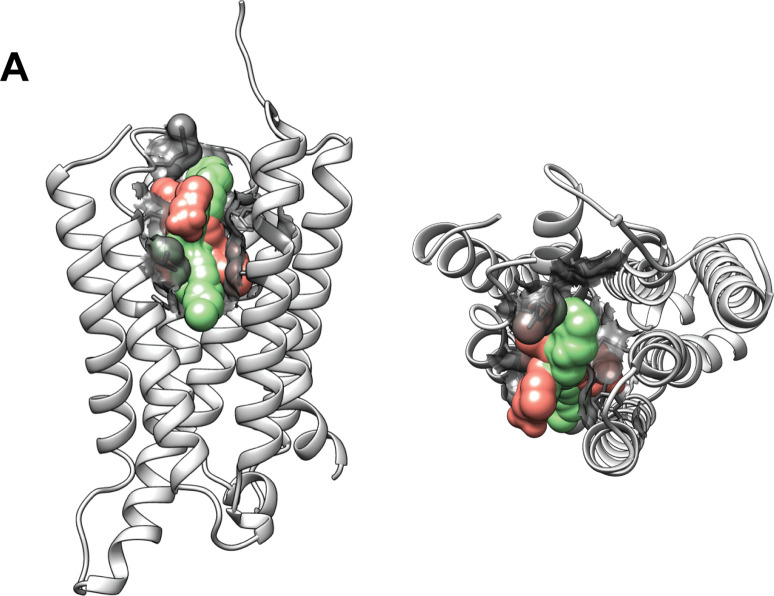
Figure 2—figure supplement 5. Structural representation of allosteric modulator binding pocket.

Figure 2—figure supplement 5.

The 7 transmembrane (7TM) domain (white) is from positive allosteric modulator (PAM) bound subunit of metabotropic glutamate receptor 2 (mGluR2; PDB:7MTS). Lateral view (left) and top view (right). Residues found to interact with PAM in structure (PDB: 7MTS) and from mutagenesis studies are shown with surface representations (gray). Ligands bound are superimposed volumes of PAMs (green; PDB: 7MTR, 7MTS, 7E9G) and NAMs (pink; PDB: 7EPE, 7EPF) solved in complex with metabotropic glutamate receptor 2 (mGluR2).