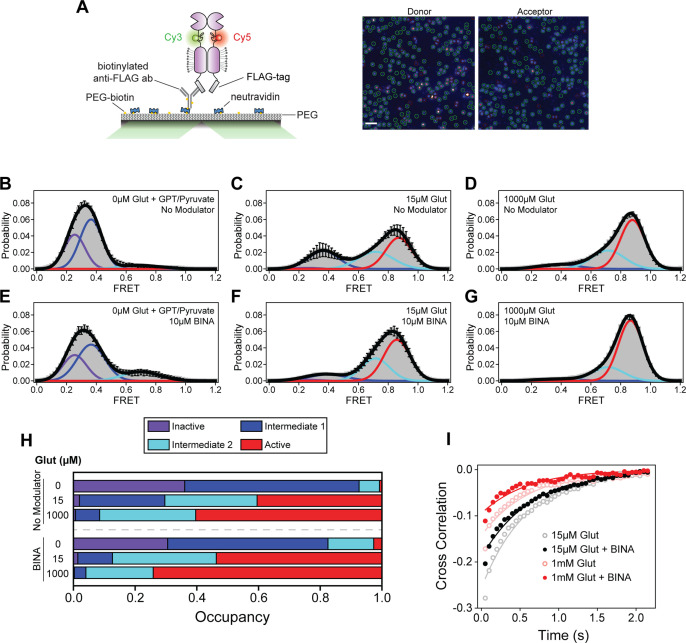
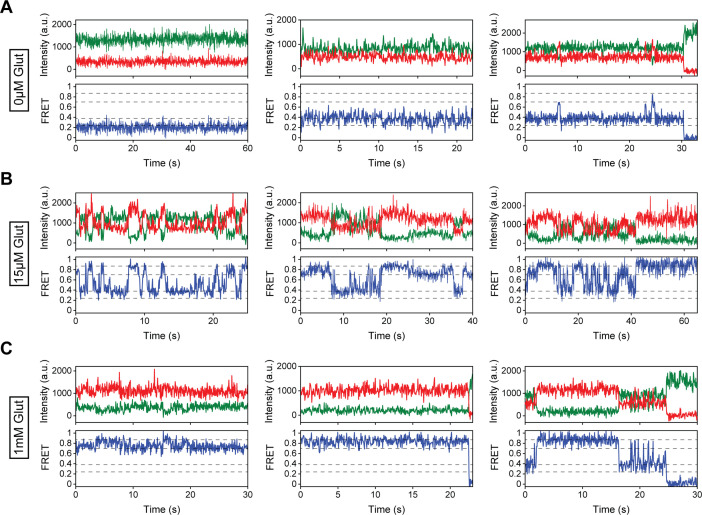
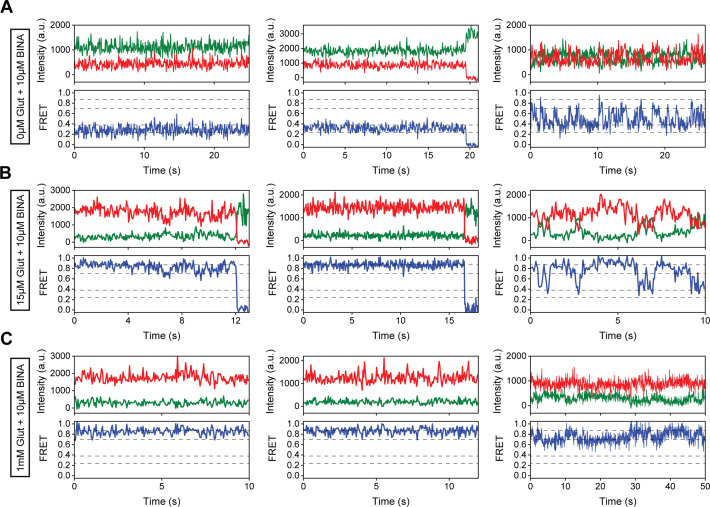
Figure 3. Single-molecule fluorescence resonance energy transfer (smFRET) analysis of BINA effects on cysteine-rich domain (CRD) conformational dynamics.
(A) Schematic of SiMPull assay (left) and representative image of donor and acceptor channels during data acquisition (right). Green circles indicate molecules selected by software for analysis. Scale bar, 3 μm. smFRET population histograms of azi-CRD in the presence of 0 μM, 15 μM, and 1 mM glutamate without (B–D) or with (E–G) 10 μM BINA. Histograms were fitted (black) to four Gaussian distributions centered around 0.24 (inactive; purple), 0.38 (intermediate 1; blue), 0.70 (intermediate 2; cyan), and 0.87 (active; red) FRET. Error bars represent SEM. Histograms (B–G) were generated from 332, 366, 253, 252, 418, and 367 individual particles, respectively. (H) Mean occupancy of four conformational states of azi-CRD in varying ligand conditions. Values represent area under each FRET peak from smFRET histogram as a fraction of total area. Mean and SEM values are reported in Table 3. (I) Mean cross-correlation of donor and acceptor intensities in the presence of intermediate (15 μM) and saturating (1 mM) glutamate with and without 10 μM BINA. Data was acquired at 50 ms time resolution. All data represents mean from three independent experiments.


