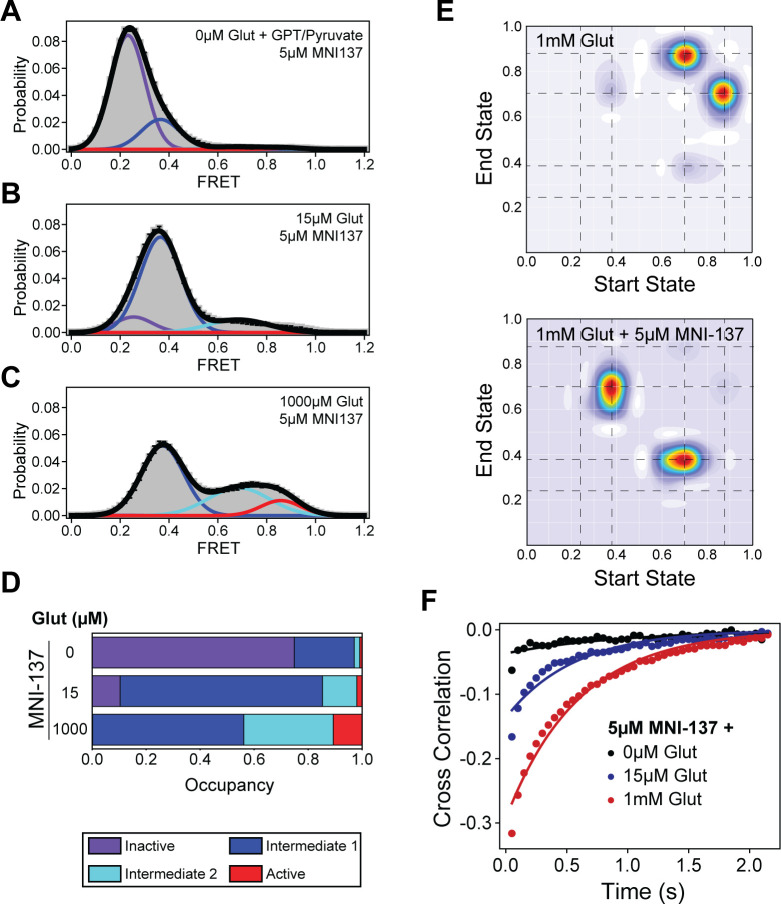
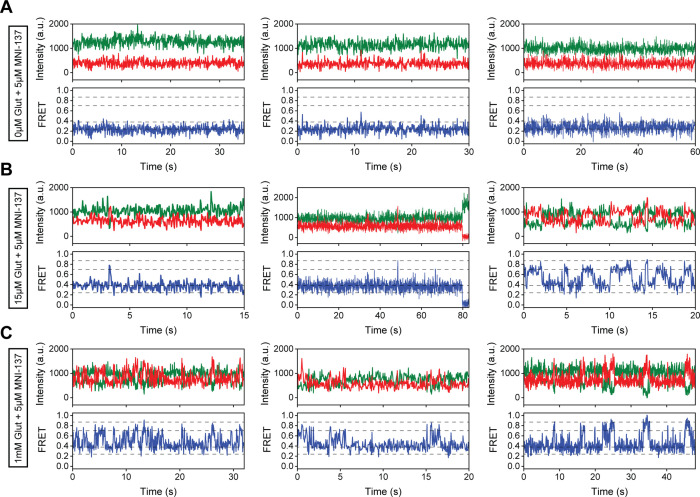
Figure 4. Single-molecule fluorescence resonance energy transfer (smFRET) analysis of MNI-137 effects on cysteine-rich domain (CRD) conformational dynamics.
(A–C) smFRET population histograms of azi-CRD sensor in the presence of 0 μM (372 particles), 15 μM (560 particles), and 1 mM (479 particles) glutamate and 5 μM MNI-137. Histograms were fitted (black) to four Gaussian distributions centered around 0.24 (inactive; purple), 0.38 (intermediate 1; blue), 0.70 (intermediate 2; cyan), and 0.87 (active; red) FRET. Error bars represent SEM. (D) Mean occupancy of four conformational states of azi-CRD in varying ligand conditions. Values represent area under each FRET peak from smFRET histogram as a fraction of total area. Mean and SEM values are reported in Table 3. (E) Transition density plots of azi-CRD at 1 mM glutamate with and without MNI-137. Dashed lines represent four distinct FRET states. (F) Mean cross-correlation of donor and acceptor intensities in the presence of 0 μM, 15 μM, and 1 mM glutamate and 5 μM MNI-137. Data was acquired at 50 ms time resolution. Data represents mean from three independent experiments.


