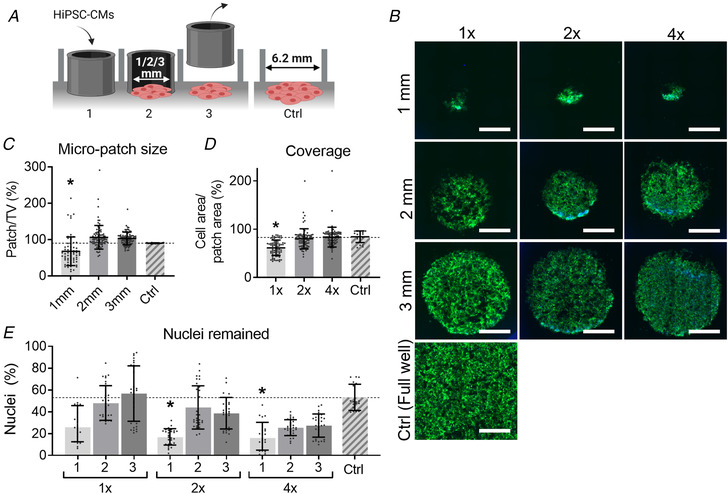
Figure 3. Assessment of the morphology of small cardiac patches.

A, method of creating 2D cardiac sheets using silicone stencils. (1) Place the stencils of various sizes (1, 2 or 3 mm) inside the well and seed hiPSC‐CMs in the stencil in desired cell density (normal (1×), double (2×) or quadruple (4×) density). (2) Culture the hiPSC‐CM for two days. (3) Remove the stencil, add 200 μL maintenance medium to every well and culture the patches for two more days. Assessment is done on day 4 after seeding. (4) A well of a 96‐well plate (TCP) was seeded with the normal cell density and was used as control (Ctrl). B, F‐actin (green) and DAPI (blue) staining for hiPSC‐CM micro‐patches with different sizes and cell densities. Scale bar represents 1 mm. C, CellProfiler data showing the relative patch size compared with the theoretical value (TV). D, CellProfiler data showing the area coverage by hiPSC‐CM calculated by dividing the cell area by the patch area. E, CellProfiler data showing the remaining percentage of nuclei, which was calculated as the number of cells counted divided by the number of cells seeded. Results from Cor.4U (NCardia) hiPSC‐CM only. Statistical analysis was done using a nested one‐way ANOVA using a Dunnet's post hoc test and groups were tested against Ctrl. n Plating = 3; n Recordings = 6 to 10 per plate. Absolute values of the P values for all comparisons (significant and non‐significant) are listed in the online Statistical Supplement. [Colour figure can be viewed at wileyonlinelibrary.com]
