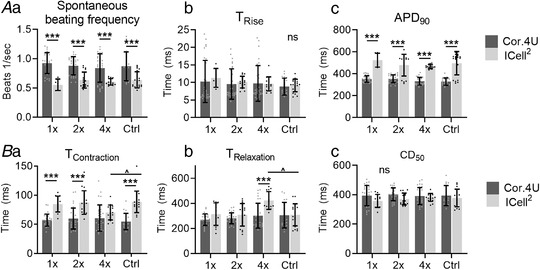
Figure 4. Differences in electrophysiology and contractility between cell‐seeding densities and commercial hiPSC‐CM cell lines.

A, electrophysiology of hiPSC‐CMs showing spontaneous beating frequency (Aa) TRise (Ab) and APD90 (Ac) for both NCardia (black) and ICell2 (grey) hiPSC‐CM cell lines. B, contractile behaviour of hiPSC‐CMs shown as contraction time (Ba), relaxation time (Bb) and CD50 (Bc) for both Cor.4U (dark grey bars) and ICell2 (light grey bars) hiPSC‐CM cell lines. n = 5–19 (ICell2) and 9–30 (Cor.4U), N = 3 experiments for both cell lines. Cell densities were compared with Ctrl for each cell type using mixed effect two‐way ANOVA with Dunnett's post hoc test (statistical significance indicated with ˆ). Differences between NCardia and ICell2 were tested between a two‐way ANOVA with Sidak's post hoc test (statistical significance indicated with *). Recordings were made on day 2 after stencil removal. Absolute values of the P values for all comparisons (significant and non‐significant) are listed in the online Statistical Supplement.
