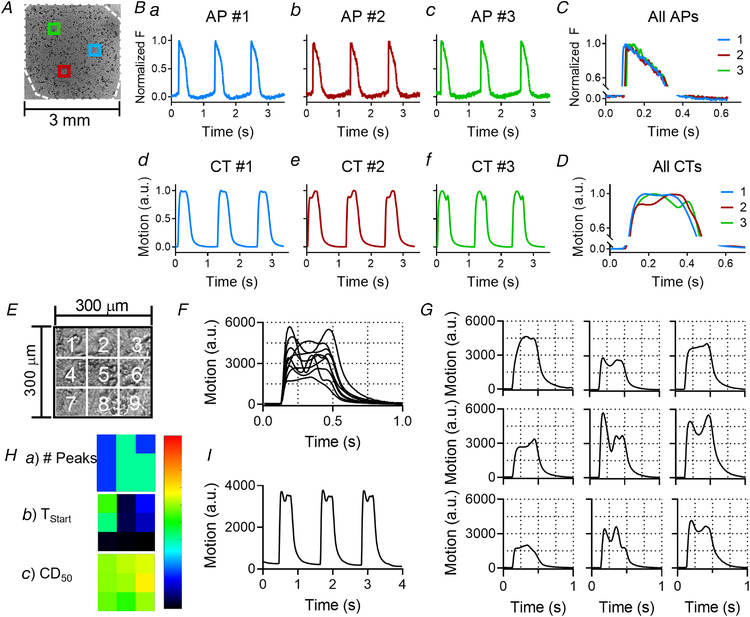
Figure 5. Significant variation in contractility and negligible variation in voltage across a hiPSC‐CM monolayer seeded on tissue culture plastic.

A, example of three different locations within the 2D micro‐patch indicated with blue, red and green squares. Each location is approximately 300 × 300 μm. The white dashed line indicates the outer line of the patch. B, action potentials (AP, top row, panels a–c) and contractility traces (CT, bottom row, panels d–f) recorded on three different locations within one well (blue, green and red inserts in panel A). APs and CTs with the same colour are recorded on the same location. C, overlay of the three APs. D, overlay of the three CTs. E, a 300 × 300 μm field of view, similar to one of the locations in panel A, was subdivided into 3 × 3 grid squares of 100 × 100 μm each. The MM algorithm was applied to every grid square. F, all traces from each grid square (nine in total) were overlapped. G, all traces from each grid square were placed in their corresponding location shown in panel E. H, heatmaps indicating (a) the number of peaks, (b) the start time (TStart) and (c) the contractile duration at 50% of the amplitude (CD50) (scalebars are 0–5 peaks, 0–40 ms and 0–600 ms, respectively). I, the contractility trace taken from the whole area (300 × 300 μm). [Colour figure can be viewed at wileyonlinelibrary.com]
