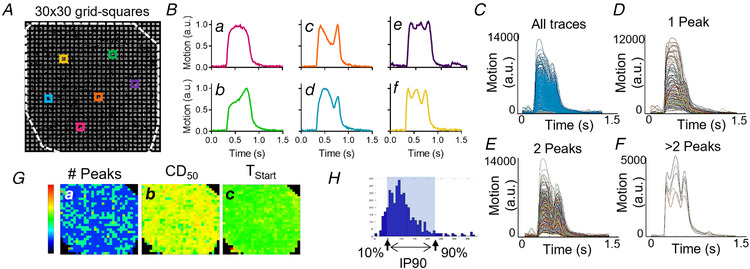
Figure 7. Spatiotemporal analysis of the entire hiPSC‐CM monolayer.

A, video frames were subdivided into 30 × 30 grid squares. Each grid square (∼100 × 100 μm) was analysed using the MM algorithm (33), resulting in 900 individual data points. B, various contractile profiles are seen at different locations within one monolayer as represented by the coloured traces (panels A and B). We observed transients containing one peak (Ba and Bb), two peaks (Bc and Bd) and more than two peaks (Be and Bf). C, all traces obtained from one video. D, all traces obtained from one video with one peak. E, all traces obtained from one video with two peaks. F, all traces obtained from one video with more than two peaks. G, values for various measurements are plotted in a heatmap. (a) The number of peaks (scalebar 1–3 peaks), (b) the contraction duration at 50% of the amplitude (CD50) (scalebar 0–1200 ms), and (c) the start times (TStart) (scalebar 0–600 ms). H, an example of the distribution of 900 data points following spatiotemporal analysis. From this distribution, the 10th–90th percentile difference (IP90) was calculated as illustrated to obtain a more realistic average within one group and thus allowing us to compare different groups. [Colour figure can be viewed at wileyonlinelibrary.com]
