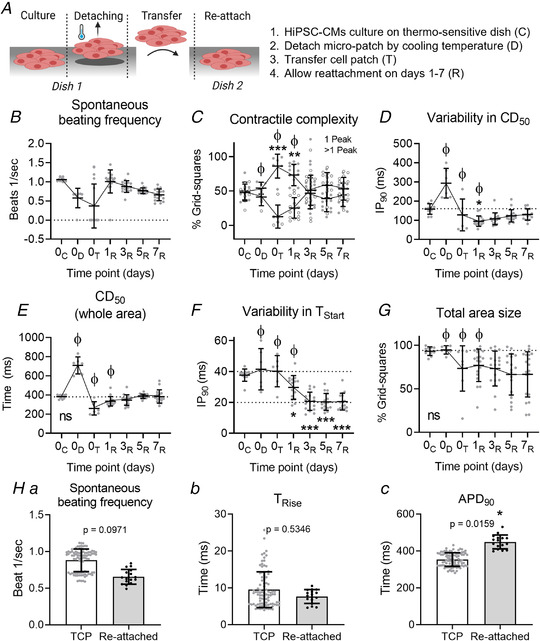
Figure 8. Contractile behaviour of hiPSC‐CMs before detachment, right after detachment and during reattachment.

A, animation explaining the experimental procedure of cell culture on a thermosensitive dish (C), cooling the plate down to 25°C, allowing the cell sheet to detach while maintaining cell–cell adhesions (D), transferring the cell sheet to a new culture dish (T) and allowing the cells to reattach to the new culture dish (R). B, spontaneous beating frequency of hiPSC‐CMs. C, the contractile complexity, expressed as the average percentage of grid squares with either single‐ (black dots) or multiple‐peaked (white dots) transients. D, the IP90 for CD50, describing the variation in contractile behaviour. E, the CD50 taken from the whole area video recording. F, the IP90 for the TStart, describing the level of synchronized contraction within the cell sheet. G, the average percentage of grid squares containing beating cells, indicating the size of the cell area. ϕ = quiescent patches were excluded from analysis at those time points. Time points were statistically tested against D0 37°C using a nested one‐way ANOVA with Dunnett's post hoc test. H, voltage recordings of reattached (D7) monolayers (Cor.4U (NCardia)) compared with data presented in Fig. 4A as these were from comparable experimental groups. Recordings were made on days 2 (TCP) and 7 after stencil removal. (a) Spontaneous beating frequency. (b) TRise. (c) APD90. Groups were compared using a nested, two‐sided t test. n Experiments = 3, n Samples = 16. A P value <0.05 is considered significant. *= P < 0.05, **= P < 0.01, ***= P < 0.001. Absolute values of the P values for all comparisons (significant and non‐significant) are listed in the online Statistical Supplement. [Colour figure can be viewed at wileyonlinelibrary.com]
