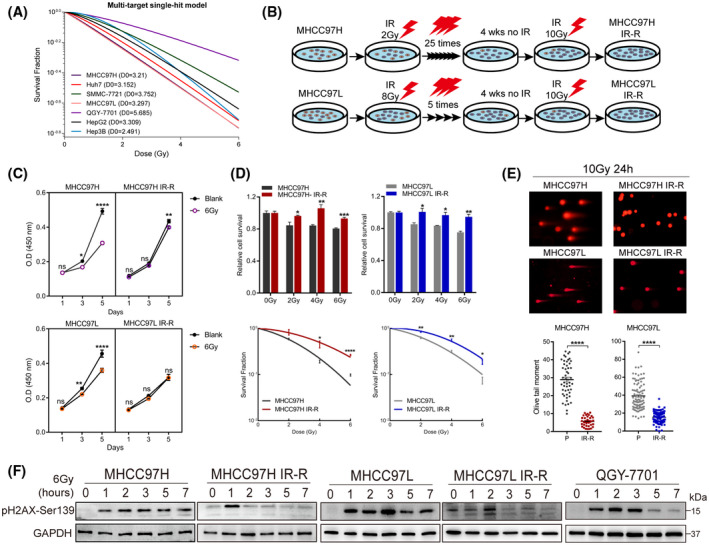
FIGURE 1.

Response of HCC cell lines to IR and generation of radiation‐resistant sublines. (A) Surviving fractions of radiation colony formation of HCC cell lines exposed to the indicated doses of IR. (B) Schematic of the generation of sublines with acquired IR‐R. (C) Proliferation of control and IR‐R cells at 1, 3, or 5 days postexposure to 6 Gy IR by CCK8 assays. (D) Relative sensitivity of parental compared with IR‐R cells to increasing dose of IR as determined by MTT assays (72 h after IR) and colony formation assays. (E) Comet assays between parental and IR‐R cells postexposure to 10 Gy IR. (F) Western blots of pH2AX‐Ser139 levels in the indicated cell lines at 0, 1, 2, 3, 5, or 7 h following IR. Survival data were normalized to those of unirradiated control cells. Data are represented as mean ± SEM of at least three replicates. *p < 0.05, **p < 0.01, ***p < 0.001, ****p < 0.0001. Abbreviations: GAPDH, glyceraldehyde 3‐phosphate dehydrogenase; OD, optical density; P, parental; ns, not significant; wks, weeks [Color figure can be viewed at wileyonlinelibrary.com]
