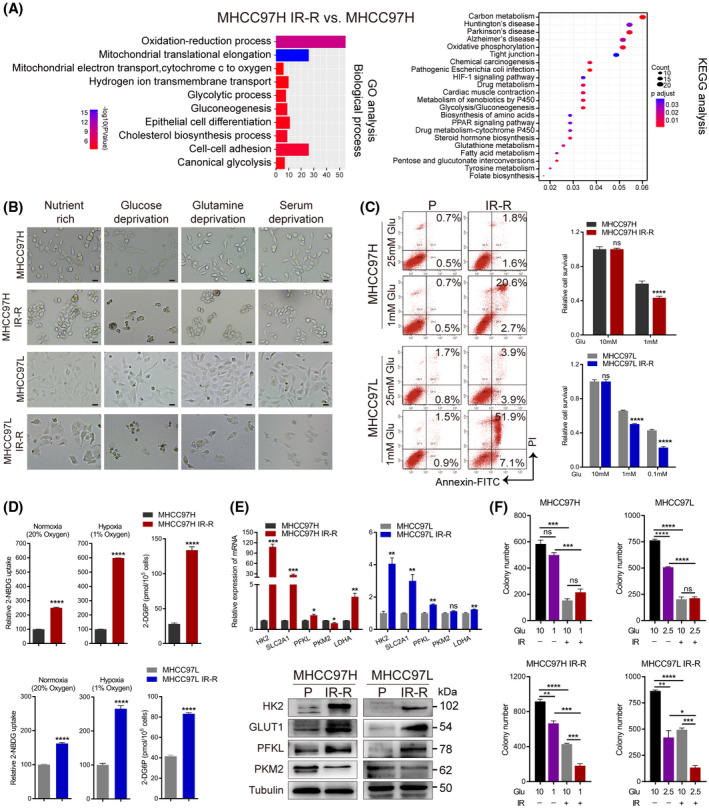
FIGURE 2.

Increased glucose metabolism fuels radioresistance in HCC cells. (A) GO and KEGG enrichment analysis of the proteome profiles between MHCC97H parental and IR‐R cells. (B) Images of control and IR‐R cells cultured for 48 h in nutrient‐rich (10% FBS and 10 mM glucose), glucose‐deprived (10% FBS and 1 mM glucose), serum‐deprived (0.1% FBS and 10 mM glucose), or glutamine‐deprived (10% FBS and 10 mM glucose but no glutamine) DMEM. Scale bars, 100 μm. (C) Effect of glucose deprivation on apoptosis and cell survival as determined by annexin V and propidium iodide staining and MTT assays. Survival data were normalized to those of control cells cultured in 10 mM glucose. (D) Relative 2‐NBDG uptake (fluorescent glucose analogue) and 2‐deoxyglucose‐6‐phosphate content (reflects glucose analogue 2‐deoxyglucose uptake) in IR‐R and parental cells. Counts for 2‐NBDG uptake were normalized to the cell count in respective parental control cultured under normoxia or hypoxia. (E) Quantitative RT‐PCR and western blots of glycolytic genes. (F) Clonogenic survival of the indicated cells cultured in DMEM containing the indicated concentration of glucose with or without 6 Gy IR. Data are represented as mean ± SEM of at least three replicates. *p < 0.05, **p < 0.01, ***p < 0.001, ****p < 0.0001. Abbreviations: 2‐DG6P, 2‐deoxyglucose‐6‐phosphate; Glu, glucose; GO, gene ontology; KEGG, Kyoto Encyclopedia of Genes and Genomes; LDHA, lactate dehydrogenase A; 2‐NBDG, 2‐(N‐(7‐nitrobenz‐2‐oxa‐1,3‐diazol‐4‐yl) amino)‐2‐deoxy‐D‐glucose; ns, not significant; P, parental; PI, prodium iodide; PKM2, pyruvate kinase M2; SLC2A1, solute carrier family 2 member 1 [Color figure can be viewed at wileyonlinelibrary.com]
