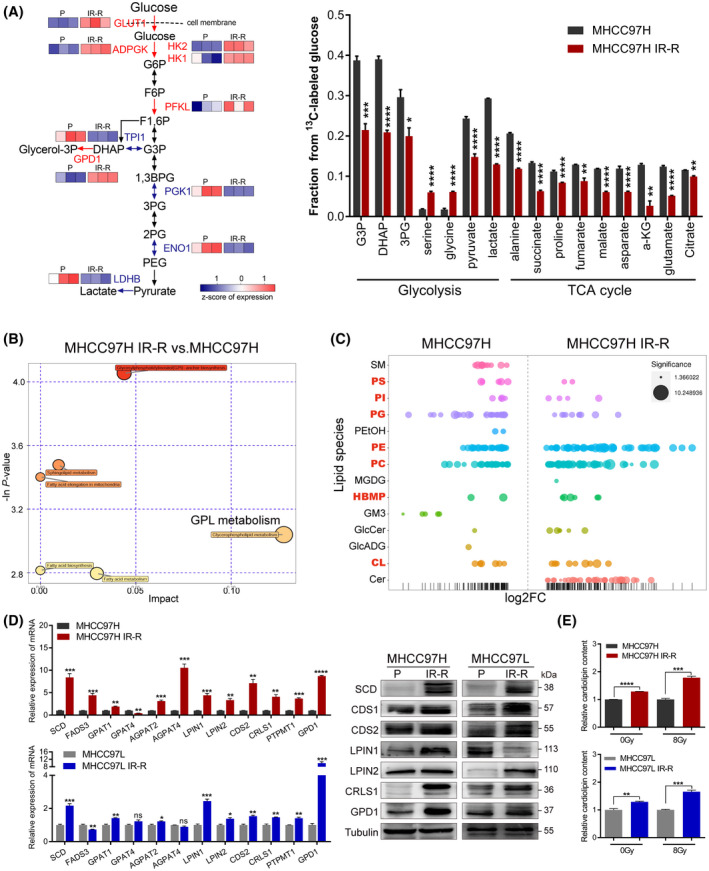
FIGURE 3.

Increased glucose flux to CL anabolism in radioresistant HCC cells. (A) 13C‐labeled glycolytic and TCA metabolites as identified by gas chromatographic–mass spectrometric analysis and corresponding protein expression of indicated enzymes in glycolysis from proteomic analyses. Red indicates overexpressed enzymes in MHCC97H IR‐R cells, n = 3/group. (B) Metabolic pathway impact analysis of metabolites by Metaboanalyst 3.0 based on results of liquid chromatography–tandem mass spectrometry–based untargeted metabolomics, n = 3/group. (C) Relative expression levels of up‐regulated and down‐regulated lipid species displayed as log2 fold change in MHCC97H IR‐R compared to MHCC97H cells. Each spot represents a species of lipids, and the spot size indicates significance. Red indicates species of GPLs, n = 6/group. (D) Quantitative RT‐PCR and western blots of genes involved in CL synthesis. (E) Relative CL content in cells under basal conditions or at 24 h after 8 Gy IR as determined by ELISA. Data were calculated relative to respective untreated or 8 Gy‐treated controls. Data are represented as mean ± SEM of at least three replicates. *p < 0.05, **p < 0.01, ***p < 0.001, ****p < 0.0001. Abbreviations: ADPGK, ADP‐dependent glucokinase; AGPAT2/4, 1‐acylglycerol‐3‐phosphate O‐acyltransferase 2/4; a‐KG, alpha‐ketoglutarate; 1,3BPG, 1,3‐bisphosphoglyceric acid; CDS1/2, cytidine diphosphate–diacylglycerol synthase 1/2; Cer, ceramide; ENO1, enolase 1; FADS3, fatty acid desaturase 3; FC, fold change; F6P, fructose‐6‐phosphate; F1,6P, fructose‐1,6‐bisphosphate; GlcADG, glucuronosyldiacylglycerol; GlcCer, glucosylceramide; GM3, ganglioside monosialic acid 3; G6P, glucose‐6‐phosphate; GPAT1/4, glycerol‐3‐phosphate acyltransferase 1/4; HBMP, human bone morphogenetic protein ; LPIN1/2, lipin 1/2; MGDG, monogalactosyldiacylglycerol; P, parental; PC, polycarbonate; PE, phosphatidylethanolamine; PEG, polyethylene glycol; PEtOH, phosphatidylethanol; PG, phosphatidylglycerol; 2PG/3PG, 2/3‐phosphoglyceric acid; PGK1, phosphoglycerate kinase 1; PI, phosphatidylinositol; PS, phosphatidylserine; PTPMT1, protein tyrosine phosphatase mitochondrial 1; SM, sphingomyelin [Color figure can be viewed at wileyonlinelibrary.com]
