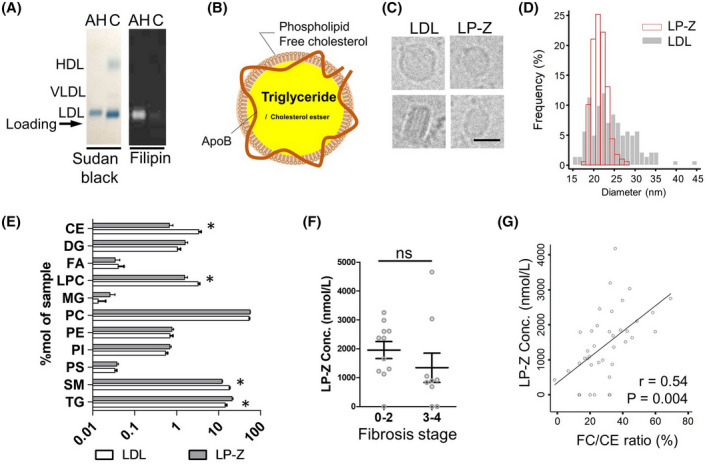
FIGURE 1.

Characteristics of lipoprotein Z (LP‐Z) in alcohol‐associated hepatitis (AH). (A) Comparison of serum lipoproteins from patients with AH and healthy control (C) analyzed by agarose gel electrophoresis. Sudan black staining of neutral lipids (triglyceride [TG] and cholesteryl ester [CE]) highlights LDL, HDL, and VLDL. Arrow indicates the reference position of sample loading. Filipin staining of free cholesterol (FC) on the same samples shown on the right. (B) Diagram of the composition of LP‐Z. (C) Representative cryo‐EM images of LDL and LP‐Z in different views. Scale bar equals 20 nm. (D) Histograms of the size of LDL and LP‐Z measured from cryo‐EM images. (E) Comparison of lipid composition between LP‐Z and LDL measured in %mol. Asterisks indicates p value < 0.005 by t test. (F) Comparison of LP‐Z in AH with advanced cirrhosis and early cirrhosis in a subcohort of Integrated Approaches for Identifying Molecular Targets (InTEAM). (G) Relationship between free cholesterol (FC)/CE ratio and LP‐Z concentration demonstrating a linear correlation. P value calculated by linear regression
