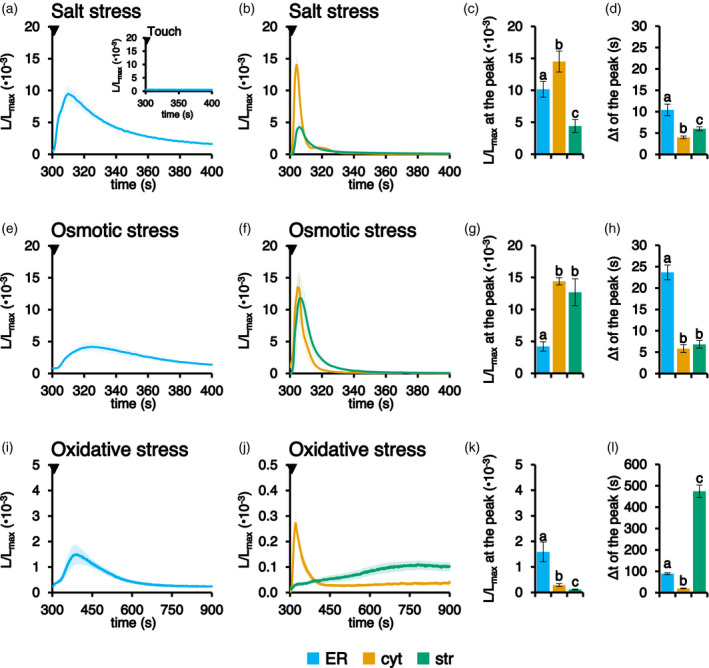
Figure 4.

Comparison between [Ca2+] dynamics in the ER, cytosol and chloroplasts in response to environmental stimuli. Ca2+ measurements were performed in Arabidopsis seedlings stably expressing aequorin in the ER (light blue trace), cytosol (cyt, orange trace) or chloroplast stroma (str, green trace). Seedlings were challenged with different abiotic stresses: (a–d) 300 mm NaCl; (e–h) 600 mm mannitol; and (i–l) 10 mm H2O2. The time scale starts at 300 sec, the time point of stimulus addition (black arrowhead), after the [Ca2+]ER refilling protocol. The inset in (a) shows a touch control (injection of an equal volume of H2O). Data are the mean (solid lines) ± SE (shading) of ≥ 6 different seedlings derived from three independent growth replicates. Statistical analyses of L/L max at the peak (c, g, k) and delay of the peak after the stimulus injection (d, h, l) are shown. Bars labelled with different letters differ significantly (P < 0.05, Student’s t test).
