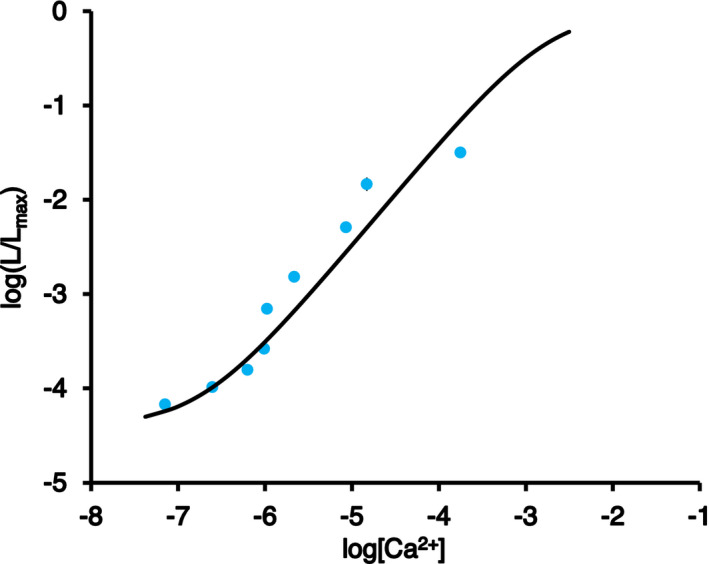
Figure 7.

Determination of the [Ca2+] calibration curve for the plant ER‐targeted fl2‐AEQmut probe. Reconstituted protein crude extracts were obtained from Arabidopsis seedlings stably transformed with fl2‐AEQmut. Luminescence emitted at 22°C (L) upon injection of 200 µl of different Ca2+ concentrations to 50 µl of reconstituted extracts was measured. At the end of each experiment, the total residual luminescence (L max) was collected by allowing full consumption of the probe via the addition of 50 μl of 1 m CaCl2. The ratio L/L max was plotted against actual [Ca2+]free corresponding to the applied [CaCl2], which was measured under the same conditions using the fluorescent calcium indicator Calcium Green™‐5N. Data are the mean ± SE of three different biological samples, each including three technical replicates. The continuous curve corresponds to the best fit of the experimental data, as described in the Experimental Procedures.
