FIGURE 6.

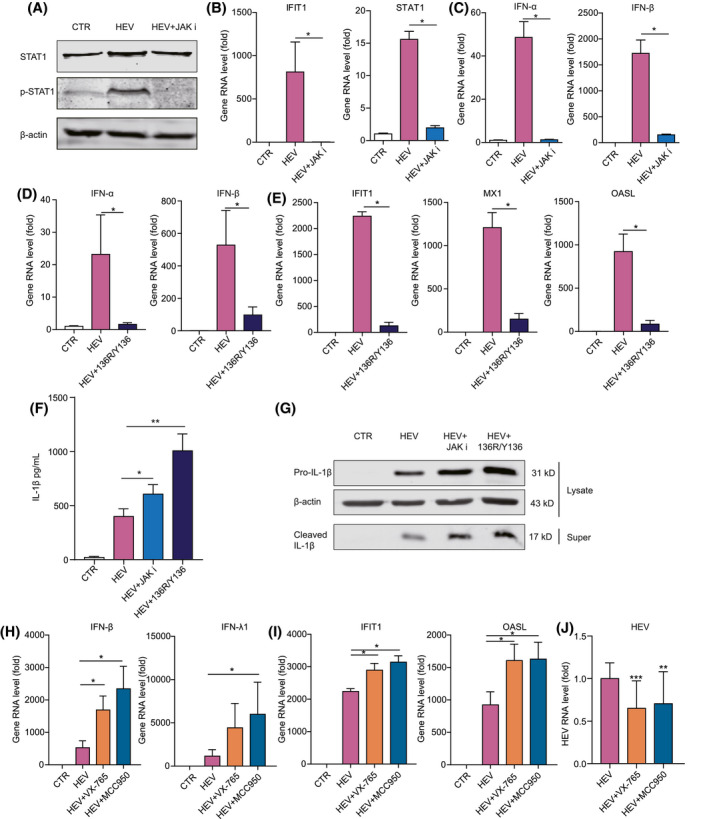
Crosstalk between HEV‐induced inflammasome activation and antiviral IFN response. (A) THP‐1 macrophage cells were transfected with GT3 HEV RNA or GT3 HEV RNA plus JAK inhibitor 1 for 24 hours. Protein expression of STAT1 and p‐STAT1 was determined by western blotting. THP‐1 macrophages were transfected with GT3 HEV RNA or GT3 HEV RNA plus JAK inhibitor 1 for 24 hours, and expression levels of ISGs (B) and IFNs (C) were quantified at 24 hours by qRT‐PCR (n = 4). THP‐1 macrophages were transfected with GT3 HEV RNA or GT3 HEV RNA plus recombinant viral 136R/Y136 for 24 hours, and expression levels of IFNs (D) and ISGs (E) were quantified at 24 hours (n = 4). THP‐1 macrophages were infected with HEV or HEV plus JAK inhibitor 1 (10 µM) or recombinant viral 136R/Y136 (1,000 ng/mL) for 24 hours. IL‐1β level in supernatant was quantified by ELISA (n = 4) (F), and mature IL‐1β in supernatant and pro‐IL‐1β in cell lysates were quantified by western blotting (G). THP‐1 macrophages were inoculated with HEV or HEV with 50 µM of Casp‐1 inhibitor (VX‐765) or 10 µM of NLRP3 inhibitor (MCC950) for 24 hours. Expression levels of IFNs (H) and ISGs (I) were quantified by qRT‐PCR (n = 4). (J) HEV‐RNA levels were quantified by qRT‐PCR (n = 18). Data were normalized to the control (CTR; set as 1). Data are means ± SD. *p < 0.05; **p < 0.01; ***p < 0.001. Abbreviations: NS, not significant (Mann‐Whitney U test); p‐STAT1, phosphorylated STAT1; Super, supernatant
