
FIGURE 7.
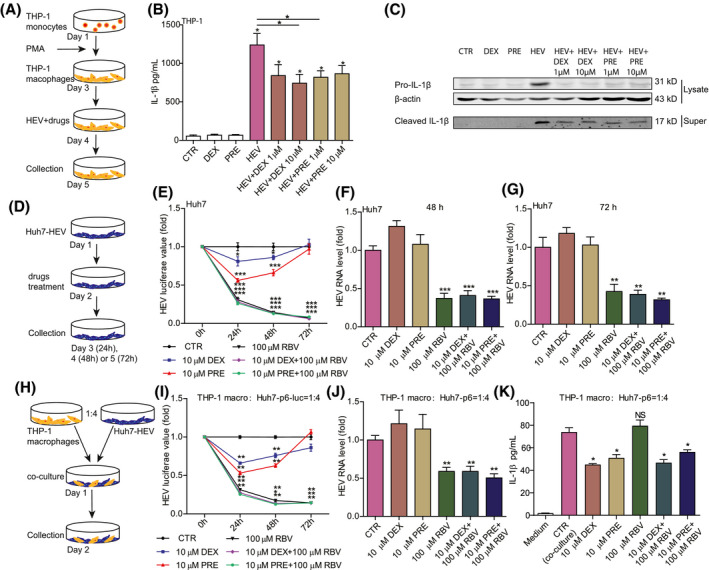
Therapeutic targeting NLRP3 inflammasome and combining with ribavirin treatment. (A) Schematic illustration of differentiation of THP‐1 monocytes to macrophages and drug treatment. THP‐1 macrophages were incubated with HEV particles and 1 or 10 µM of dexamethasone (DEX) or 1 or 10 µM of prednisone (PRE) for 24 hours. (B) IL‐1β protein levels were quantified by ELISA (n = 6), and (C) mature IL‐1β in supernatant and pro‐IL‐1β in lysates were measured by western blotting. (D) Schematic illustration of DEX or PRE treatment in Huh7‐p6 and Huh7‐p6‐luc HEV models. Huh7‐p6‐luc or Huh7‐p6 cells were treated with 10 µM of DEX, 10 µM of PRE, 100 µM of ribavirin, 10 µM of DEX plus 100 µM of ribavirin, or 10 µM of PRE plus 100 µM of ribavirin for 24, 48, and 72 hours. (E) HEV luciferase values were measured. HEV‐RNA levels were quantified at 48 (F) and 72 (G) hours by qRT‐PCR (n = 6‐8). (H) Schematic illustration of the coculture system of Huh7‐based HEV cells with THP‐1 macrophages. The coculture was treated with 10 µM of DEX, 10 µM of PRE, 100 µM of ribavirin, 10 µM of DEX plus 100 µM of ribavirin, or 10 µM of PRE plus 100 µM of ribavirin for 24, 48, and 72 hours. (I) HEV luciferase values were measured. HEV‐RNA levels were quantified at 48 hours (J) by qRT‐PCR (n = 4‐6), and IL‐1β levels (K) were measured by ELISA (n = 4). Data were normalized to the control (CTR; set as 1). Data are means ± SD. *p < 0.05; **p < 0.01; ***p < 0.001. Abbreviations: NS, not significant (Mann‐Whitney U test); Super, supernatant