
FIGURE 1.
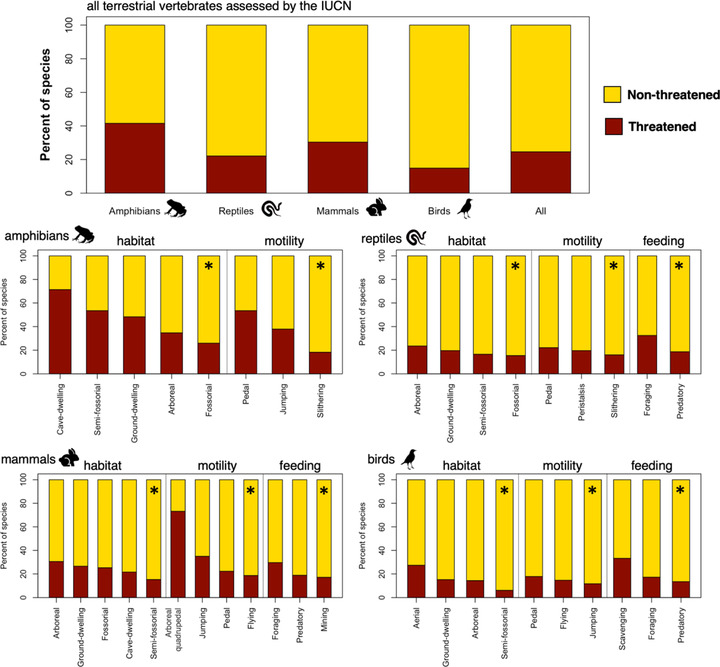
Percentage of threatened (red) and nonthreatened (yellow) species for all terrestrial vertebrate species in the study together and separately by terrestrial vertebrate group and ecological niche (order is descending) (*, ecological trait in each ecological niche with the lowest percentage of threatened species set as the reference level in the phyloglm analysis)