
FIGURE 2.
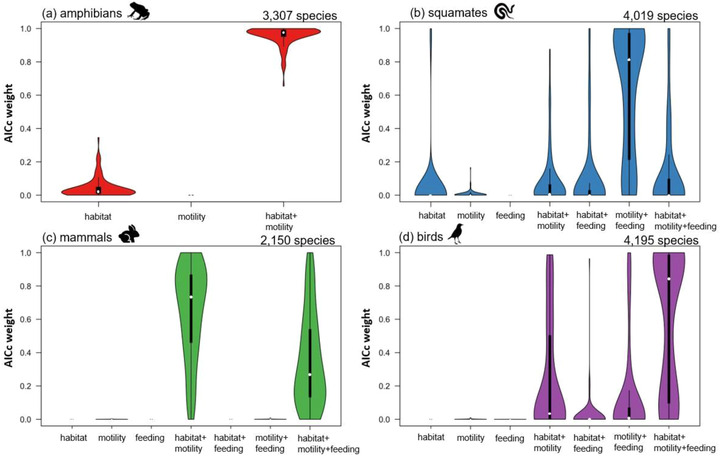
Model support from phyloglm analyses of corrected Akaike information criterion (AICc) values across the 100 phylogenetic trees for (a) amphibians, (b) squamates, (c) mammals, and (d) birds (white dot, median; thick black line, interquartile range; thin black line, 1.5 × interquartile range)