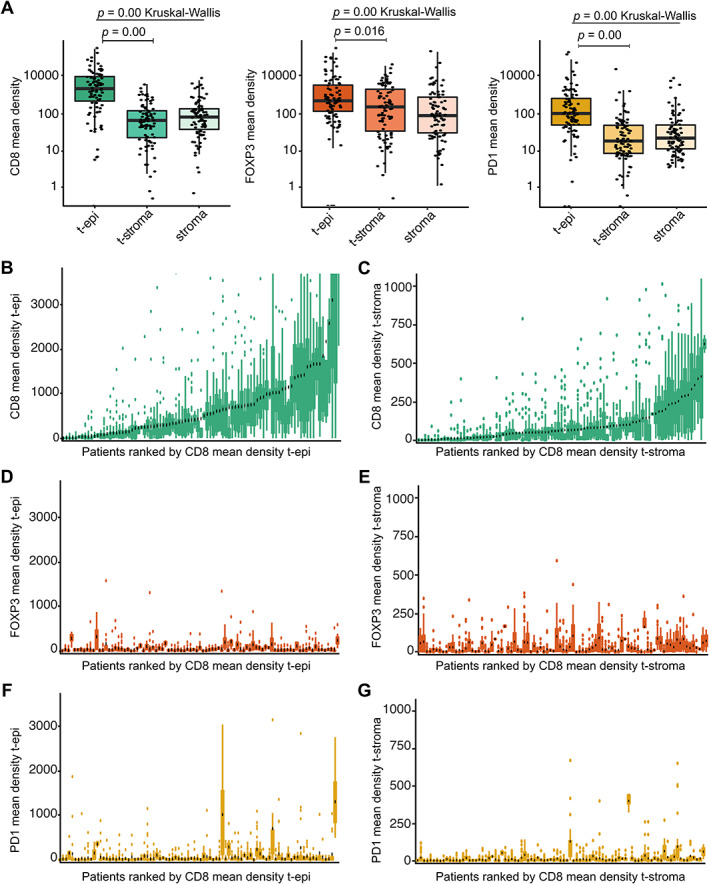
Figure 4.

Heterogeneity in tumor‐associated immune cell (TAIC) density in EAC resections post‐nCRT. (A) The mean densities (cells/mm2) of CD8+, FOXP3+, and PD‐1+ TAICs in the tumor epithelium (t‐epi), tumor stroma (t‐stroma), and non‐tumor stroma (stroma) of post‐nCRT resection specimens. The Kruskal–Wallis test was used to detect overall difference of TAIC density between the three compartments. Post hoc analysis was performed with the pairwise Wilcoxon rank sum test and Benjamini–Hochberg P value adjustment. TAIC density in log10 scale (Y‐axis). (B, C) The mean densities (cells/mm2) of CD8+ TAICs in (B) the tumor epithelium (t‐epi) and (C) tumor stroma (t‐stroma). Patients are ranked by CD8 mean density. (D, E) The mean densities (cells/mm2) of FOXP3+ TAICs in (D) the tumor epithelium (t‐epi) and (E) tumor stroma (t‐stroma). Patients are ranked by CD8 mean density. (F, G) The mean densities (cells/mm2) of PD‐1+ TAICs in (F) the tumor epithelium (t‐epi) and (G) tumor stroma (t‐stroma). Patients are ranked by CD8 mean density.
