
Figure 6.
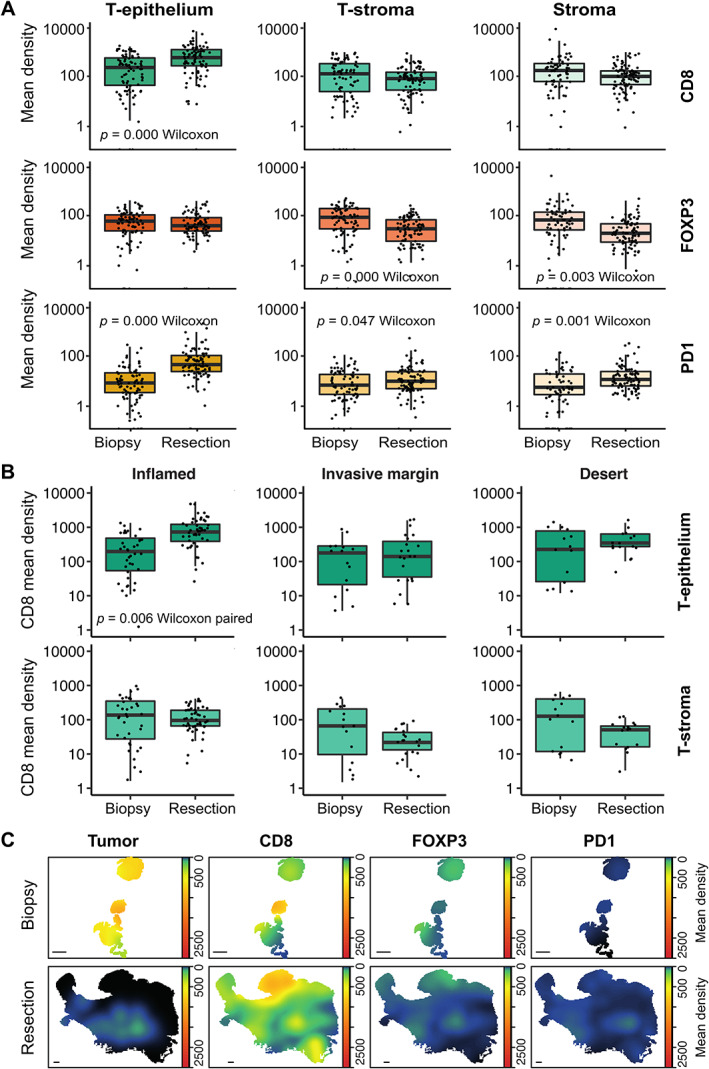
The difference in immune landscapes in pretreatment biopsies and post‐nCRT resection specimens. (A) The difference in mean CD8+, FOXP3+, and PD‐1+ TAIC density (cells/mm2) between pretreatment biopsies and post‐nCRT resection specimens in the tumor epithelium (T‐epithelium), tumor stroma (T‐stroma), and non‐tumor stroma (Stroma). (B) The difference in CD8+ mean density (cells/mm2) between pretreatment biopsies and post‐nCRT resection specimens in the tumor epithelium (T‐epithelium) and tumor stroma (T‐stroma) per immune‐landscape pattern. (C) Tumor cells and CD8+, FOXP3+, and PD‐1+ TAIC density heat maps of a representative biopsy with matched inflamed post‐nCRT resection specimen. Scale bar: 1 mm. (A, B) Statistical differences between biopsy and resection specimens were determined by the paired Wilcoxon signed‐rank test. The Y‐axis is depicted in log10 scale.