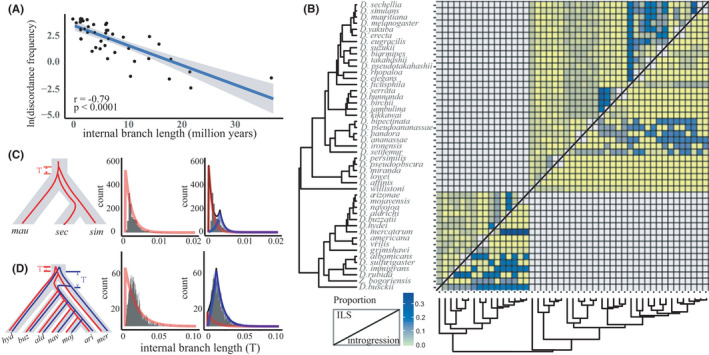
FIGURE 2.

Causes of gene tree and species tree discordance. (a) Discordance frequency calculated by discovista as a function of branch length in our Drosophila species tree. The grey shaded region indicates the 95% confidence interval from a linear model (“lm” function in R). (b) Species pairwise metrics for the proportions of ILS (above diagonal) and introgression (below diagonal) estimated by quibl. More blue denotes a higher value. (c) Left, ILS is the only factor causing the closer genomic relationship between D. mauritiana and D. sechellia. The grey background indicates the species tree and the red line indicates the ILS genealogy. “T” is the internal branch length under ILS. Middle and right panels show the distribution of the internal branch lengths supporting the closer relationship of D. mauritiana and D. sechellia, which fitted better with the model assuming only ILS (middle, average of Bayesian information criteria (BIC) = –1815.24) than it did with the model assuming a mixture of ILS and introgression (right, average of BIC = –1776.57). The blue line denotes the inferred distribution of introgression, the red line denotes ILS and the black line their combination. The histograms show the distribution of internal branch lengths of individual trees supporting a closer relationship of D. mauritiana and D. sechellia. mau, mauritiana; sim, simulans; sec, sechellia. (d) Left, both ILS and introgression occurred during the evolution of the repleta group. The grey background indicates the species tree, the blue line denotes the genealogy of introgression and the red lines denotes that of by ILS. “T” is the internal branch length for the corresponding genealogies. The middle and right panels show that the distribution of the internal branch lengths supporting the closer relationship of D. mercatorum and the ancestor of the five mulleri subgroup species fitted better with a model assuming a mixture of ILS and introgression (right, average of BIC = –1415.26) than it did with a model assuming ILS only (middle, average of BIC = –1359.66). The histograms show the distribution of internal branch lengths of individual trees supporting a closer relationship of D. mercatorum and the ancestor of the five mulleri subgroup species. hyd, hydei; buz, buzzatii; ald, aldrichi; nav, navojoa; moj, mojavensis; ari, arizonae; mer, mercatorum
