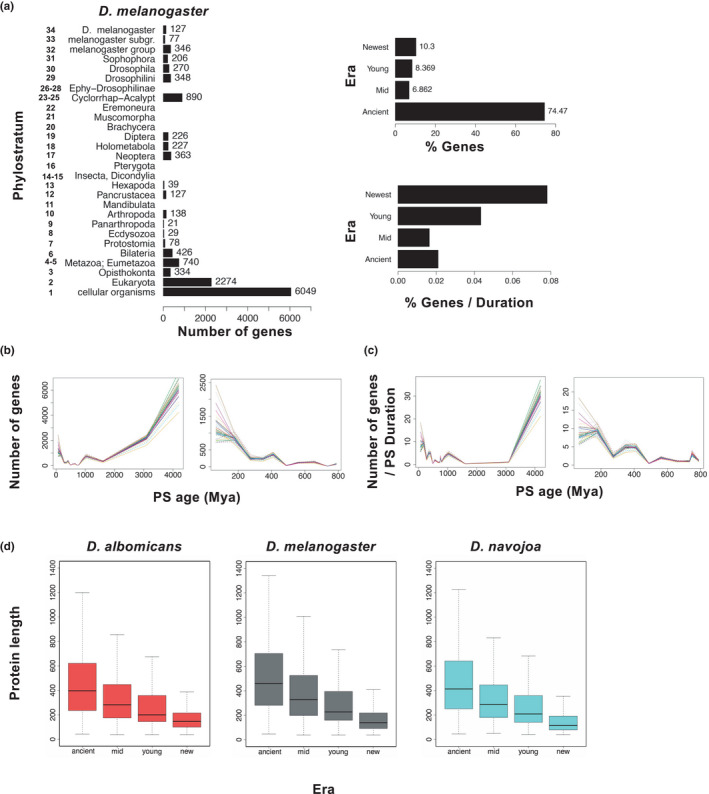
FIGURE 3.

Temporal dynamics of novel gene gain and loss. (a) Raw numbers of novel genes in D. melanogaster estimated to have arisen in the 34 phylostrata (left) and four eras (top right), and the number of these genes arising in the four eras normalised for the (very different) durations of the eras (lower right). (b) Plots of the absolute numbers of genes estimated to have arisen in each phylostratum for each of the 47 species up to 4290 Ma (left) and zoomed in to 800 Ma (right). (c) Plots of the phylostratum duration‐normalised numbers of genes estimated to have arisen in each phylostratum for each of the 47 species up to 4290 Ma (left) and zoomed in to 800 Ma (right). Each species in (b) and (c) is represented by a different colour (same in each plot). See Figures S6 and S7 for further details. (d) Average lengths of proteins encoded by genes originating in the different evolutionary eras in three species from phylogenetically diverse lineages
