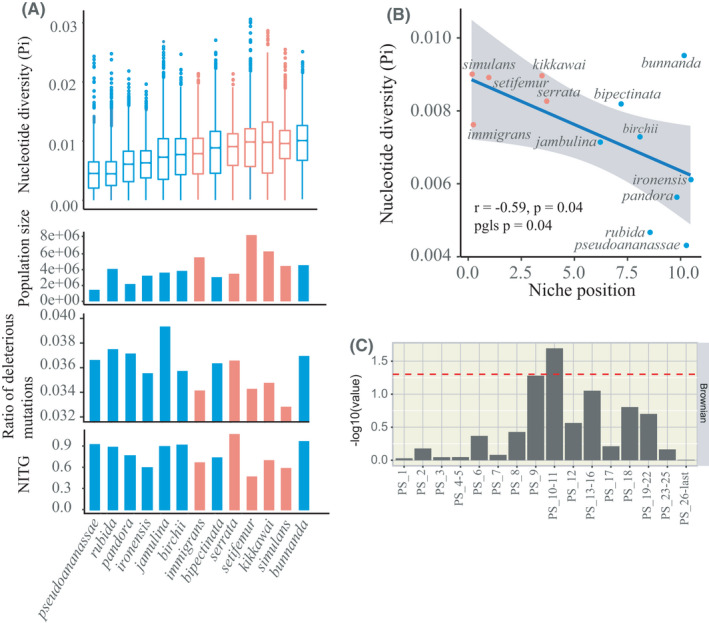
FIGURE 5.

Population genomic statistics for tropics‐restricted specialists (blue) vs. widespread generalists (red). (a) Top two panels: The average overall nucleotide diversity (Pi) and effective population size (N e) were generally larger in the generalists than the tropics‐restricted specialists. Bottom two panels: The proportion of deleterious mutations and neutrality index NITG were generally smaller in the generalists than the tropics‐restricted specialists. (b) Pi was significantly negatively correlated with niche position. Confidence limits were calculated using the lm function in R. The generalists are shown in red and the specialists in blue in all panels in (a) and (b). (c) Significance of the correlation between effective population size and gene numbers across the 13 species for different phylostrata. Significance was determined using PGLS methods and assuming a Brownian motion model as detailed in the Materials and Methods (see also Figure S16 legend)
