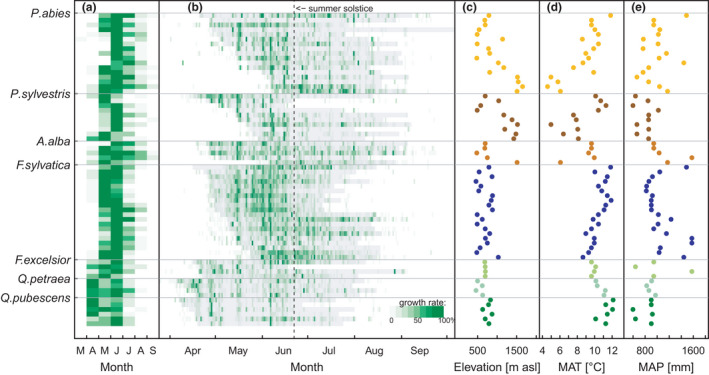
FIGURE 2.

Monthly and daily growth rates of seven tree species at 47 sites in Switzerland covering the years 2012 till 2018. (a) Median monthly growth rates in % per species and site. (b) Median daily growth rates in % per species and site. Grey areas indicate the median growth period per species and site. Growth values in (a) and (b) are scaled per row (site × species) so that each row has mean = 50% and SD = 1. All trees and years per site and species were averaged. (c) Elevation per site, (d) Mean annual temperature (MAT) per site and (e) Mean annual precipitation (MAP) per site. Colours in (c–e) indicate different species. Sites are ordered according to GROstart
