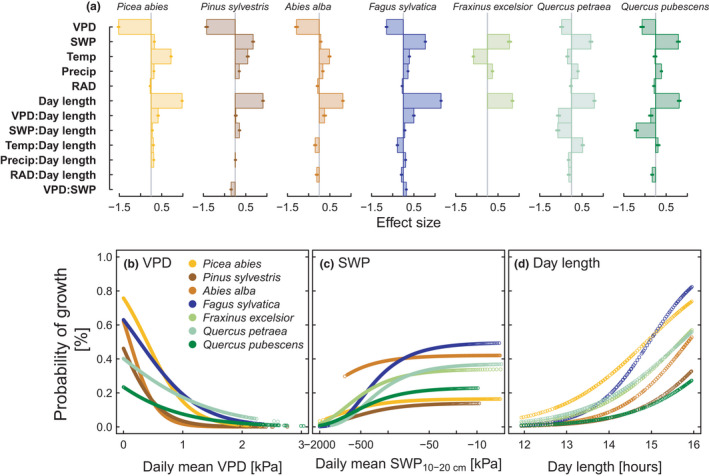
FIGURE 5.

Probability of growth in relation to environmental variables. (a) Effect sizes of fixed effects derived from GLMM in Table S4 with growth/no growth as binary response variable and year nested in tree nested in site as random effects. (b–d) Probability of growth derived from GLMM in relation to (b) VPD, (c) SWP and (d) Day length. Different colours indicate different species
