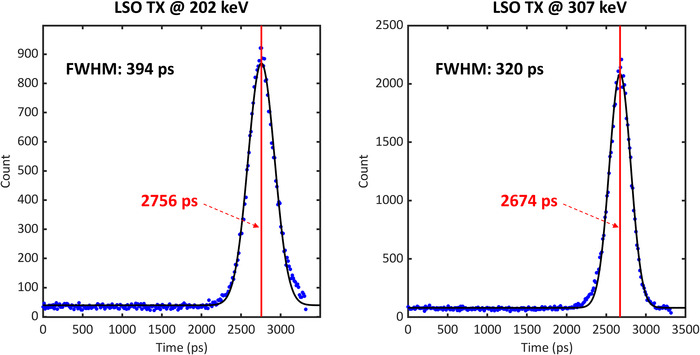
FIGURE 5.

The timing spectrum of lutetium oxyorthosilicate (LSO) transmission events (Tx) at 202 (left) and 307 (right) keV between crystals located in the same axial coordinates with a radial distance of 82 cm; the blue dots show the measured data and the black lines show the Gaussian fit applied to the data. The red line also represents the peak position in each figure
