
FIGURE 6.
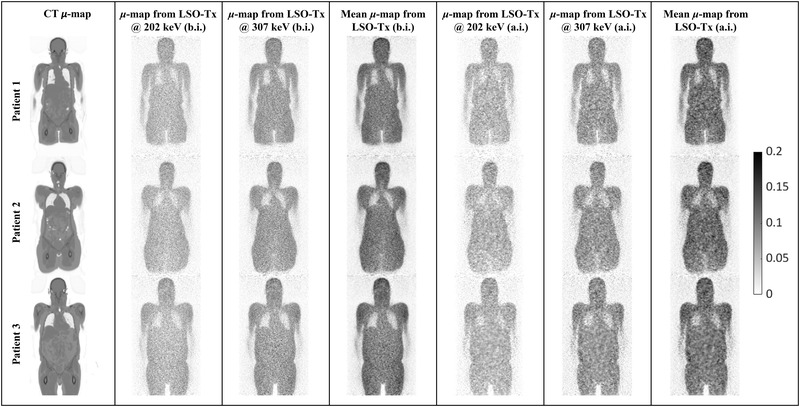
A sample coronal slice across the attenuation maps (μ‐maps) (in 1/cm) of the three studied patients obtained from the 202 and 307 keV photons from lutetium oxyorthosilicate (LSO) transmission events (Tx) before (b.i.) and after (a.i.) the injection of the radiotracer; note that the 202 and 307 keV μ‐maps generally underestimate linear attenuation coefficients due to the lack of a scatter correction. The mean μ‐maps are, however, scaled through a postreconstruction scaling step