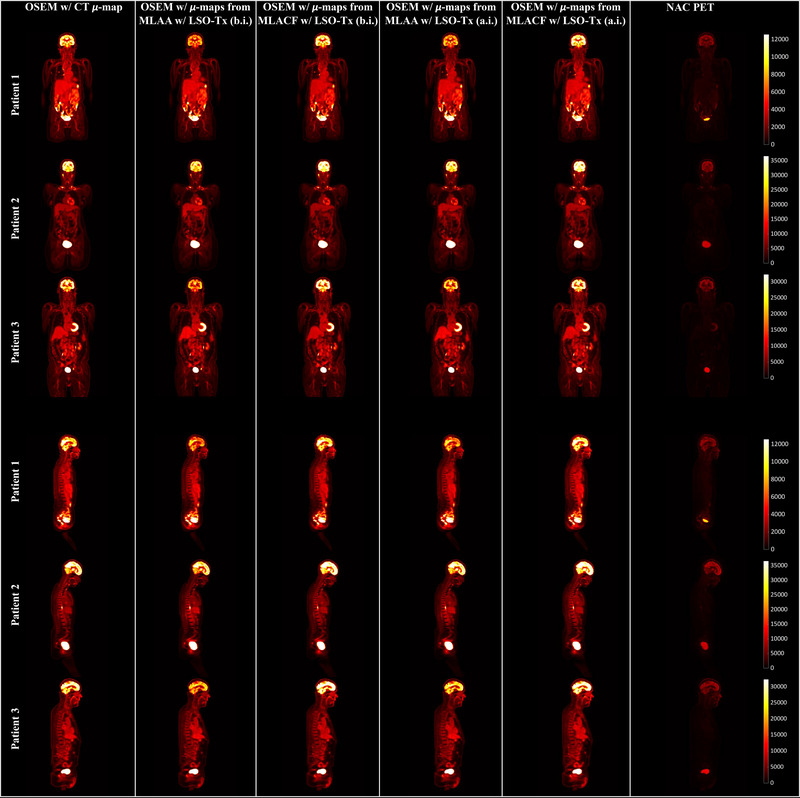
FIGURE 9.

Sample slice of positron emission tomography (PET) images from ordered subset expectation maximization (OSEM) using, from left to right, computed tomography (CT)–based, maximum likelihood estimation of attenuation and activity (MLAA) with lutetium oxyorthosilicate (LSO) transmission events (Tx) before injection (b.i), maximum likelihood estimation of activity and attenuation correction coefficients (MLACF) with LSO‐Tx b.i., MLAA with LSO‐Tx after injection (a.i.), MLACF with LSO‐Tx a.i. attenuation maps, and non‐attenuation‐corrected (NAC) PET data
