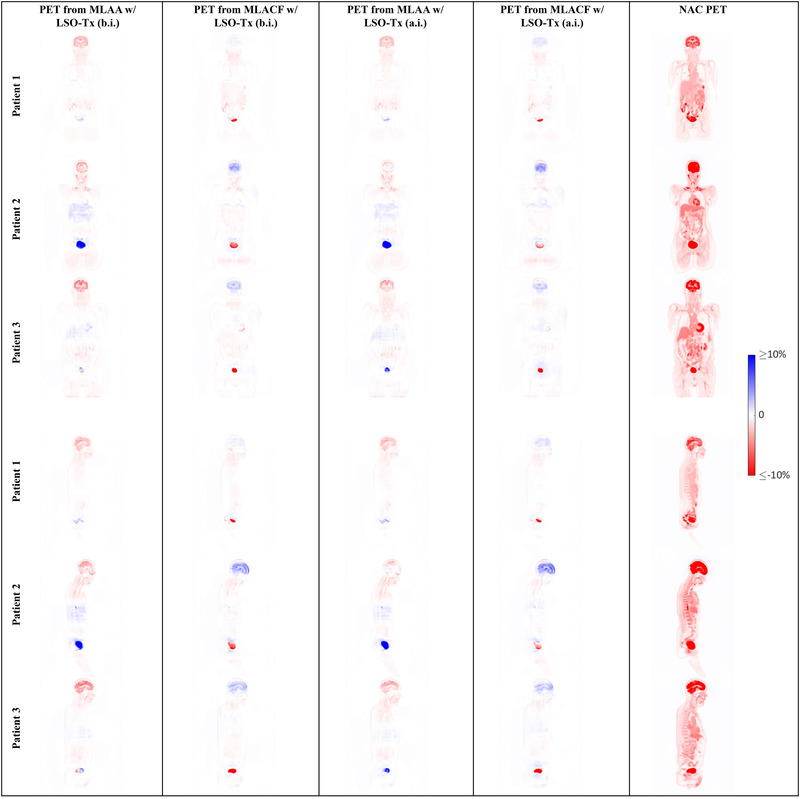
FIGURE 10.

Sample slices showing the relative difference between the positron emission tomography (PET) images corrected with computed tomography–based attenuation maps (μ‐maps) and PET images using the μ‐maps from various joint reconstruction techniques
