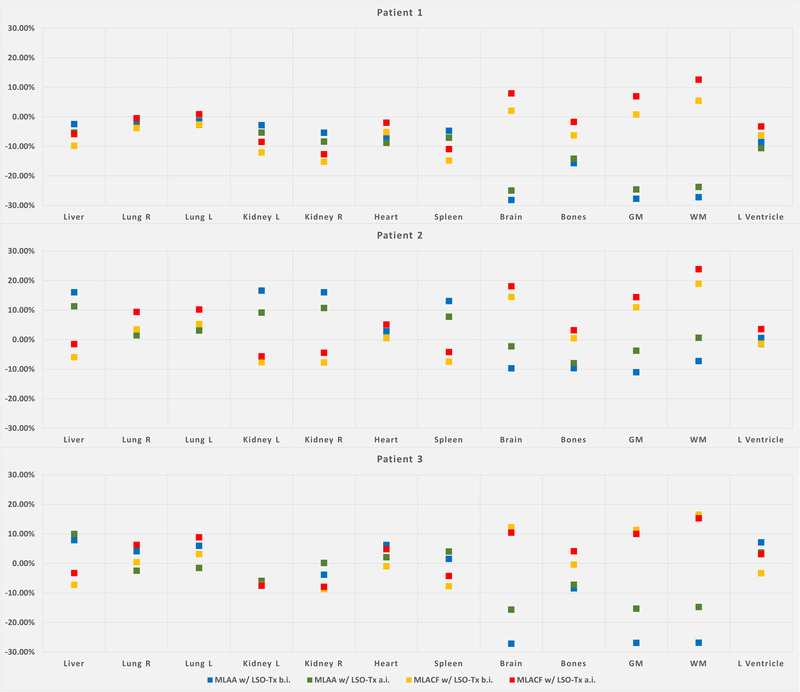
FIGURE 11.

Percentage standardized uptake value difference in various organs between positron emission tomography images obtained using attenuation maps from different joint reconstruction techniques and computed tomography for the three studied patients (GM: grey matter; WM: white matter)
