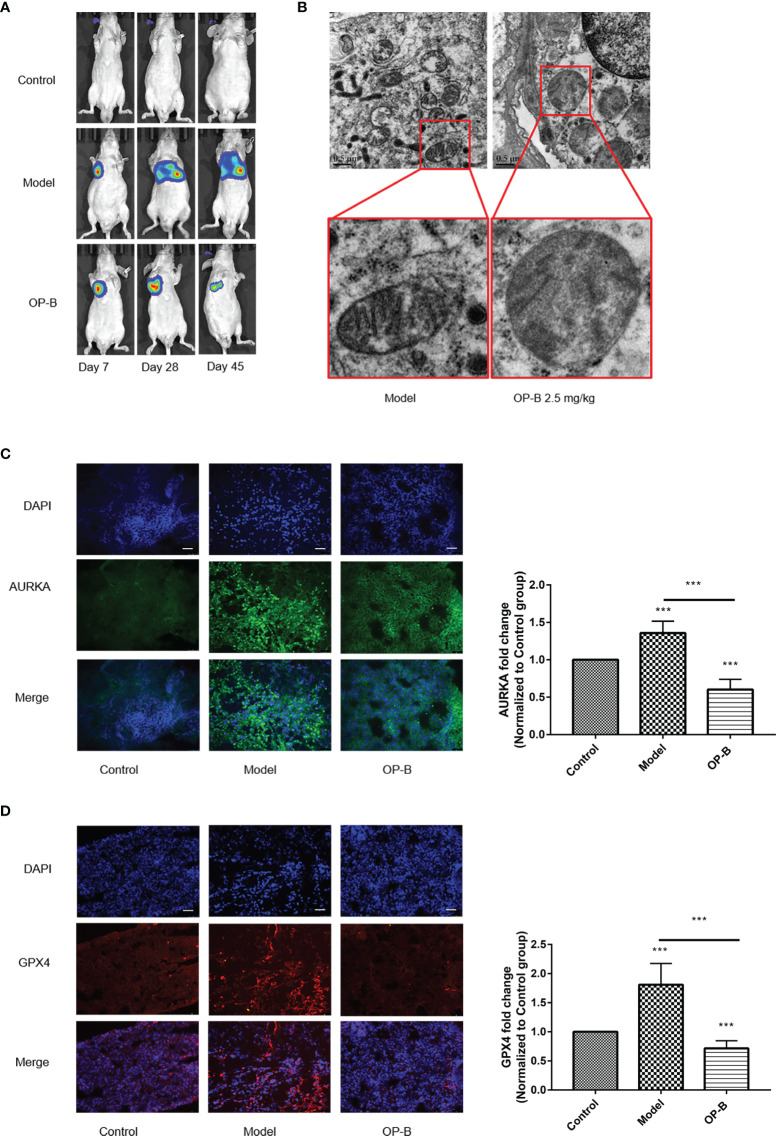
Figure 10.
Ophiopogonin B (OP-B) induced ferroptosis in vivo. (A) Bioluminescence imaging of the OP-B-administered groups with right lung parenchyma injection of luciferase-labeled A549 cells. (B) Transmission electron microscopy images of the model group and the OP-B-administered group (2.5 mg/kg) in nude mice. (C) Immunofluorescence staining of the expression of AURKA in the model group and OP-B-treated group in nude mice. (D) Immunofluorescence staining of the expression of GPX4 in the model group and OP-B-treated group in nude mice. Data bars and error bars indicate the mean ± SD. ***p < 0.001.

