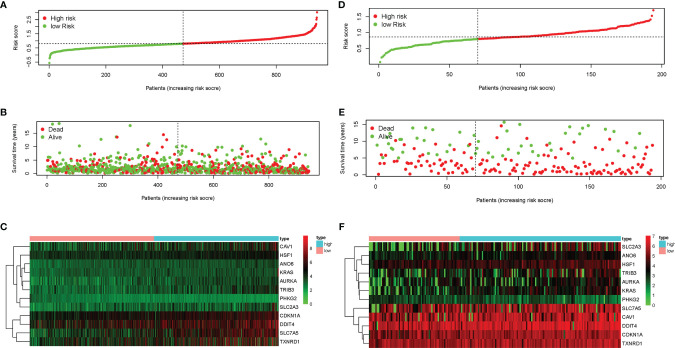
Figure 3.
Characteristics of the prognostic genes in the gene signature. (A, B, D, E) Distribution of risk scores (A) and the patient survival time and non-small cell lung cancer (NSCLC) status (B) in The Cancer Genome Atlas (TCGA) and the Gene Expression Omnibus (GEO) (D, E). The black dotted line is the optimal cutoff value used to classify patients into the low-risk and high-risk groups. (C, F) Heat map of the ferroptosis-related gene expression profiles in the prognostic features of NSCLC in TCGA (C) and GEO (F). “High” represents the high-risk group and “low” the low-risk group in the heat map.

