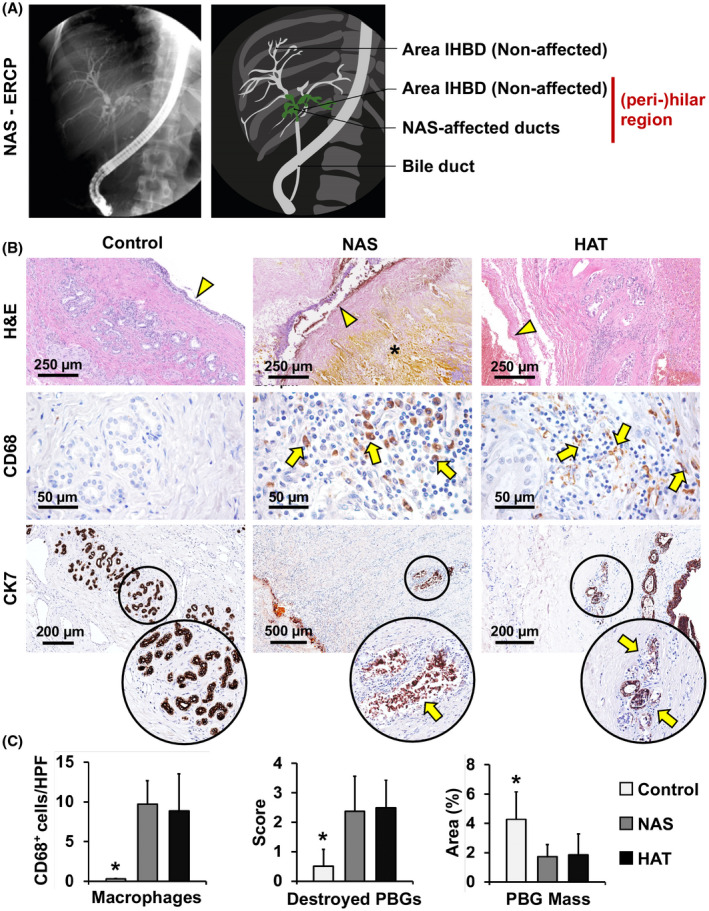
FIGURE 1.

Radiological and microscopic presentation of NAS. (A) Endoscopic retrograde cholangiography (ERCP) showing NAS at the level of the hepatic duct and segmental intrahepatic bile ducts (green area), around the hilar region. (B) H&E stains (upper panels) and IHC for CD68 (middle panels) and CK7 (lower panels) of bile duct specimens obtained from patients retransplanted for nonbiliary causes (control), NAS, or HAT. In comparison to controls, bile ducts affected by NAS and HAT were characterized by loss of surface epithelium (arrowheads) and stroma destruction (asterisk). Infiltrating CD68+ macrophages (arrows, middle panels) can be observed in NAS and HAT. In the lower panels, arrows indicate damaged PBGs in NAS and HAT, magnified in the circles below. (C) Histograms show quantification (mean and SD) of CD68+ cells, destroyed PBGs, and PBG mass. *p < 0.05 versus other groups. Abbreviation: IHBD, intrahepatic bile duct
