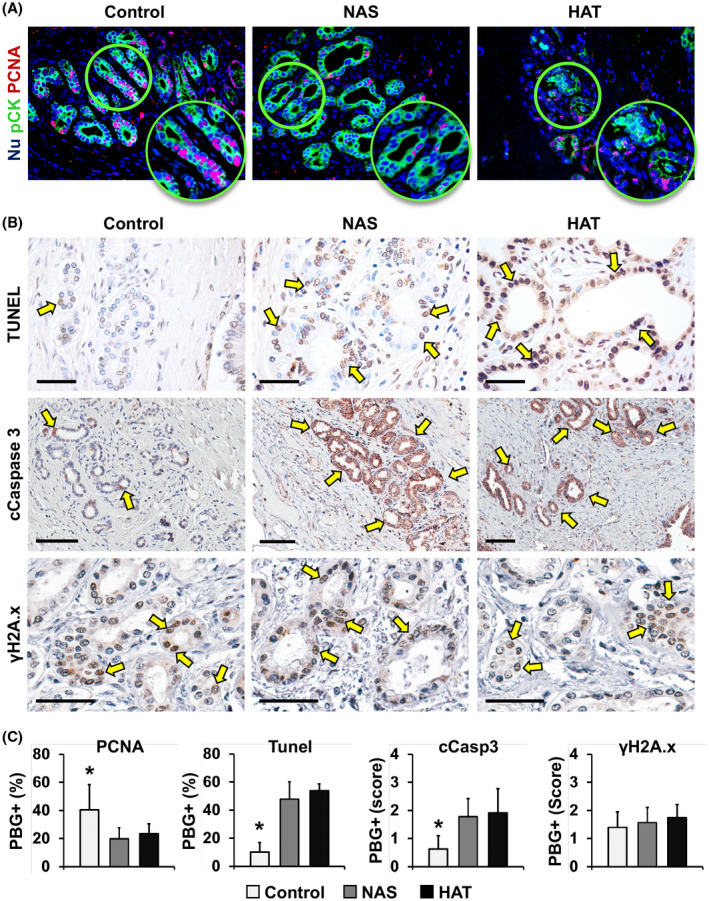
FIGURE 2.

PBG proliferation, apoptosis, and senescence. (A) IF for pCK (green) and PCNA (red) of bile duct specimens obtained from patients retransplanted for nonbiliary causes (control), NAS, or HAT. Nuclei were counterstained with DAPI and are displayed in blue. (B) TUNEL assay (upper panels) and IHC for cleaved (c)Caspase 3 (middle panels) and γH2A.x (lower panels). Arrows indicate positive cells. Scale bars, 100 µm. (C) Histograms show quantification (mean and SD) for PCNA‐ (PBG proliferation index) and TUNEL‐positive (PBG apoptosis) cells within PBGs and for the SQ score of cCaspase 3 (PBG apoptosis) and γH2A.x (PBG senescence). *p < 0.05 versus other groups
