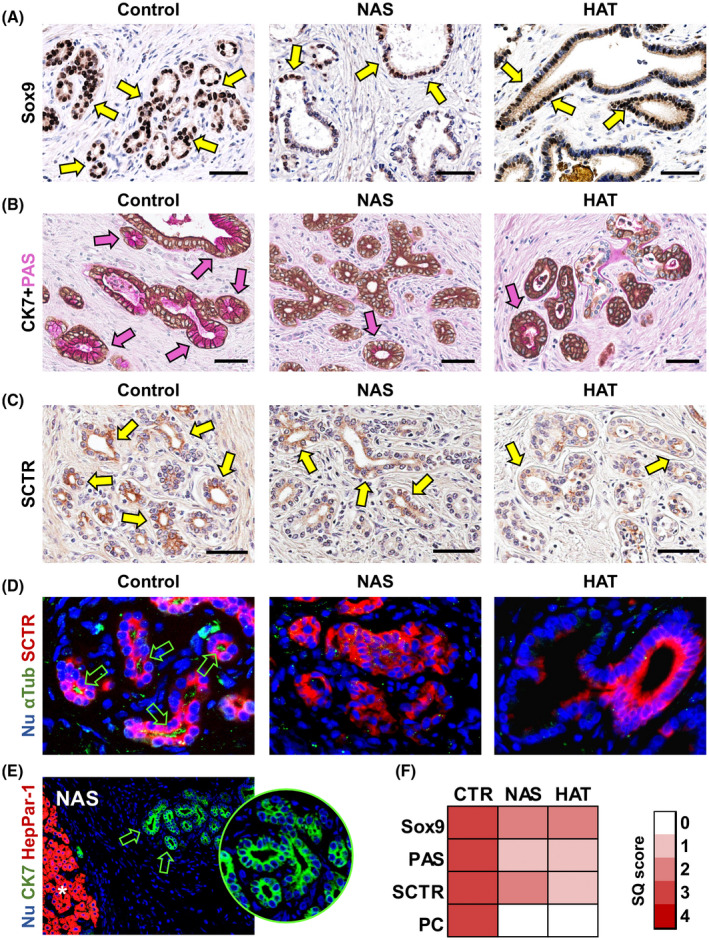
FIGURE 3.

PBG cell phenotype. (A) IHC for transcription factor Sox9 in bile duct specimens obtained from patients retransplanted for nonbiliary causes (control), NAS, or HAT. Scale bars, 100 µm. (B) IHC for CK7 counterstained with PAS in control, NAS, and HAT groups. Scale bars, 50 µm. (C) IHC for SCTR in control, NAS, and HAT groups. Scale bars, 50 µm. (D) Double IF for α‐acetylated tubulin (αTub; green) and SCTR (red) in control, NAS, and HAT groups. Green arrows indicate cells with primary cilium (PC). Original magnification: ×40. (E) IF for CK7 and HepPar1 in specimens of NAS‐affected bile ducts. Original magnification: ×10. Asterisk indicates hepatocytes within liver parenchyma (positive control for HepPar1); PBGs are indicated by green arrows and magnified in the circle. (F) Heatmap reports SQ scores for Sox9, PAS, and SCTR positivity and cells with PC in PBGs. In (A‐C), arrows indicate positive cells within PBGs. In (D‐E), nuclei are counterstained with DAPI and displayed in blue. Abbreviations: CTR, control; Nu, nuclei
