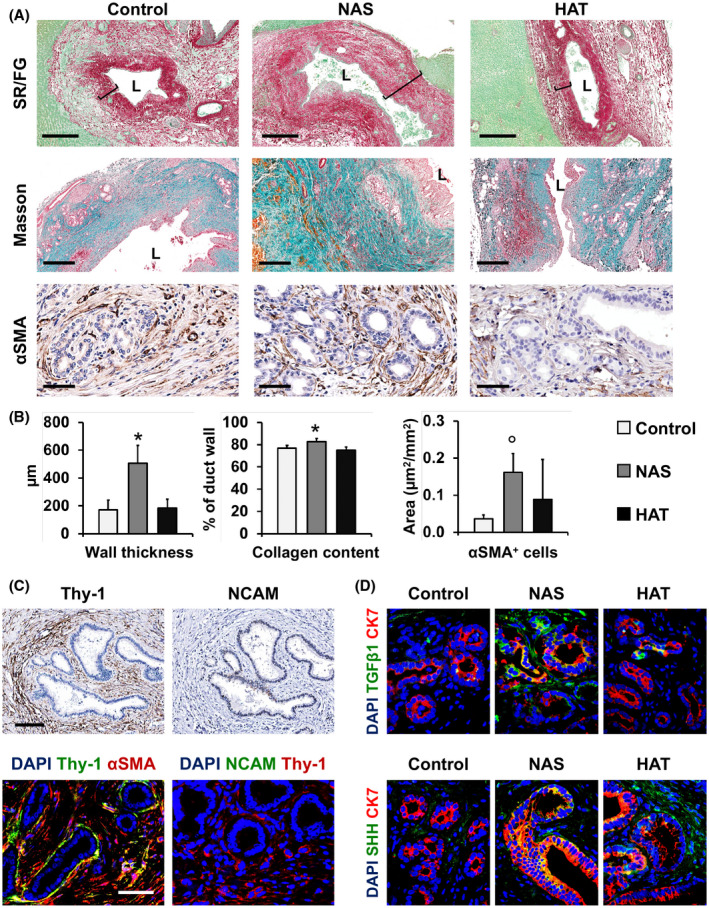
FIGURE 4.

Collagen fiber deposition and myofibroblast activation. (A) SR/fast green (FG) stain (upper panels), Masson’s trichrome stain (middle panels), and IHC for αSMA in bile duct specimens obtained from patients retransplanted for nonbiliary causes (control), NAS, or HAT. In (A), inset bars show the duct wall thickness. Scale bars, 500 µm (SR/FG and Masson) and 50 µm (αSMA). (B) Histograms show quantification (mean and SD) of duct wall thickness, collagen content of bile duct walls (expressed as percentage of bile duct wall), and of the number of αSMA+ cells per mm2 area around PBGs. *p < 0.05 versus other groups. (C) IHC on serial sections for Thy‐1 and NCAM (upper panels) and double IF (lower panels) for Thy‐1 and αSMA (left) and NCAM and Thy‐1 (right) in NAS specimens. Scale bars, 100 µm (upper panels) and 50 µm (lower panels). (D) Double IF for TGFβ1 (green, upper panels) and SHH (green, lower panels) with CK7 (red) of control, NAS, and HAT groups. Original magnification: ×40. In (C,D), nuclei were counterstained with DAPI and are displayed in blue. Abbreviation: L, lumen
