FIGURE 5.

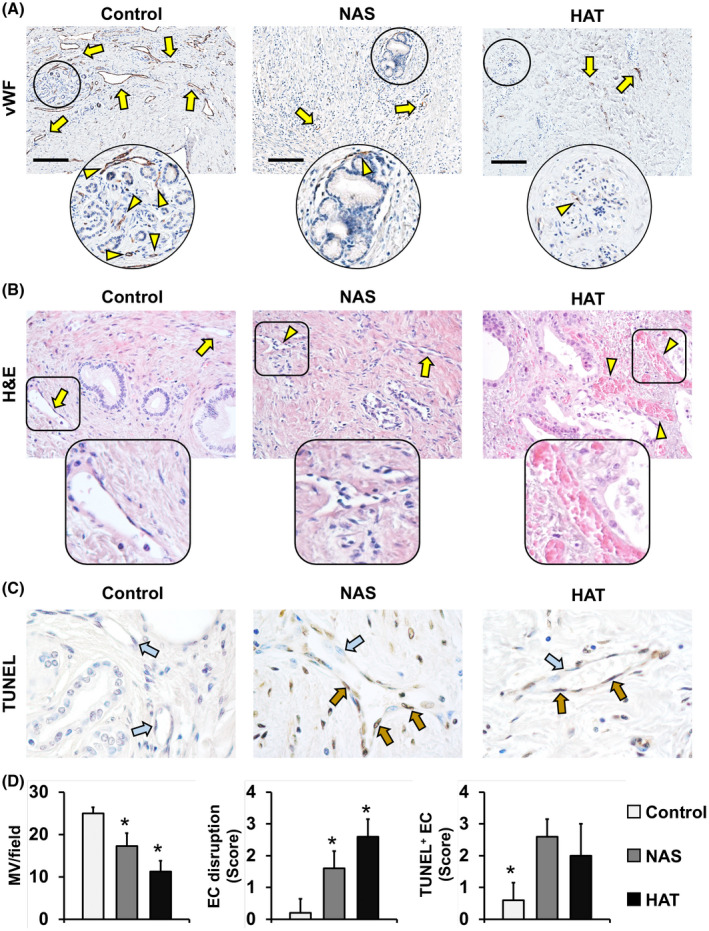
Modifications of the peribiliary vascular plexus. (A) IHC for vWF in bile duct specimens obtained from patients retransplanted for nonbiliary causes (control), NAS, or HAT. vWF+ vessels (arrows) and the MVD around PBGs (arrowheads) are shown. Areas in circles are magnified below. Scale bars, 200 µm. (B) H&E stains show normal vessels (arrows) and damaged ones (arrowheads) in the bile duct wall. Areas in squares are magnified below. Original magnification: ×20. (C) TUNEL assay shows nonapoptotic (blue arrows) and apoptotic (brown arrows) endothelial cells (ECs). Original magnification: ×40. (D) Histograms show quantification (mean and SD) of vWF+ microvessel (MV) density within bile ducts, score of EC disruption, and TUNEL+ ECs. *p < 0.05 versus other groups
