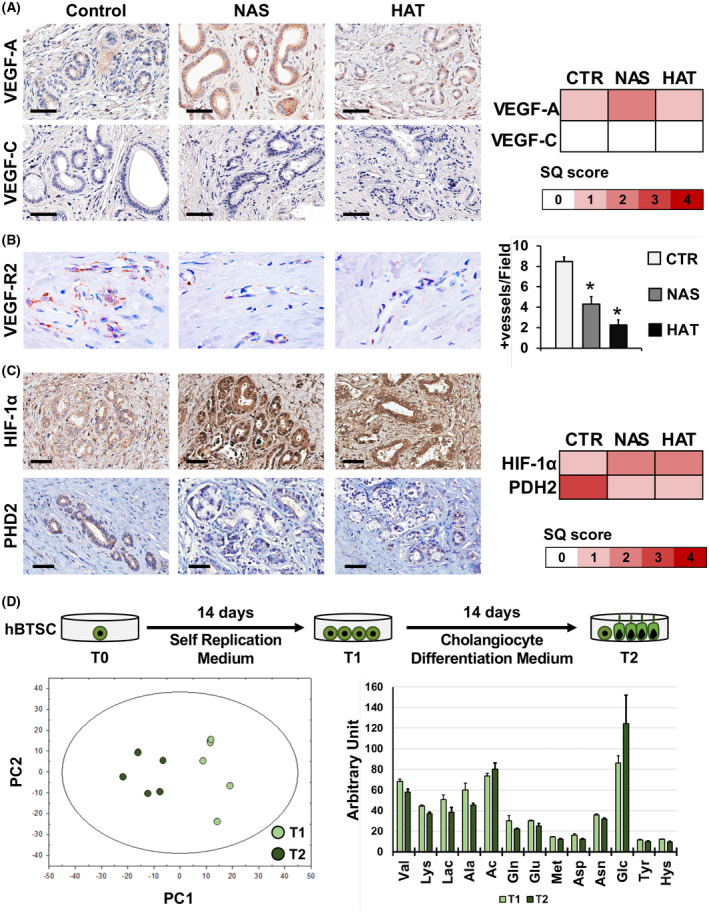
FIGURE 6.

Angiogenic response and metabolism of PBG cells. (A) IHC for VEGF‐A (upper panels) and VEGF‐C (lower panels) in bile duct specimens obtained from patients retransplanted for nonbiliary causes (control), NAS, or HAT. Heatmap reports SQ scores for VEGF‐A and VEGF‐C positivity in PBGs. Scale bars, 100 µm. (B) IHC for VEGF‐R2. Original magnification: ×40. Histogram shows quantification (mean and SD) of VEGF‐R2+ vessels per high‐power field (40×). *p < 0.05 versus other groups. (C) IHC for HIF‐1α (upper panels) and PHD2 (lower panels). Scale bars, 100 µm. Heatmap shows SQ scores for HIF‐1α and PHD2 expression in PBGs. (D) Human biliary tree stem/progenitor cells (hBTSCs) were cultured in self‐replicating conditions (KM) for 14 days (T1) and then transferred in a medium tailored for CholM for another 14 days (T2). Metabolites in collected media were analyzed by NMR and explored by principal component (PC) analysis, producing a solution with two significant components, cumulatively explaining 85% of the total variance in the data. The histogram shows quantification (means and SD) of metabolites in culture medium with significant differences comparing T1 with T2. Abbreviation: CTR, control
